Projects ECG (Electrocardiogram) Monitoring
Patent & Technology
Patent
1. ECG analysis using Hilbert transform - P/R/T peak detect
2. ECG Axis Deviation using Hilbert Transform
3. The start and end points of a QRS complex using imaginary numbers
Technology
1. Scalogram
2. ECG analysis using Hilbert transform - R peak detect
3. ECG QRS complex using Hilbert transform
4. QRS complex J point I
5. QRS complex J point II
6. Detect Bundle Branch Block using Phase space
7. R Axis deviation using Phase space
8. Atrial fibrillation
9. P wave duration and axis deviation
10. T wave axis deviation
11. QT interval I
12. QT interval II
13. QT interval III
14. Myocardial infarction I
15. Myocardial infarction II
16. Myocardial infarction III
17. Myocardial infarction IV
18. Myocardial infarction V
19. Cardiomyopathy and Myocarditis
..
Business Direction
Digital ECG Monitoring
Conventional analog methods cannot track changes in individual ECG data, and it is also
difficult to compare and analyze current and past data.
-> In traditional ways, it is often too late to visit a hospital because the patient feels abnormal, failing to
diagnose whether a healthy person is approaching heart disease.
Assumes a system combined with mobile devices and cloud services
If you can observe and analyze changes in ECG data regularly (or intermittently) over a relatively long period of time, it is more likely to prevent worsening of heart disease.
-> It is also possible to develop new diagnostic methods through the use of big data.
To realize this, it is necessary to build
an ECG monitoring system composed of ECG measuring devices, mobile devices, and cloud services.
- ECG Monitoring System Concept
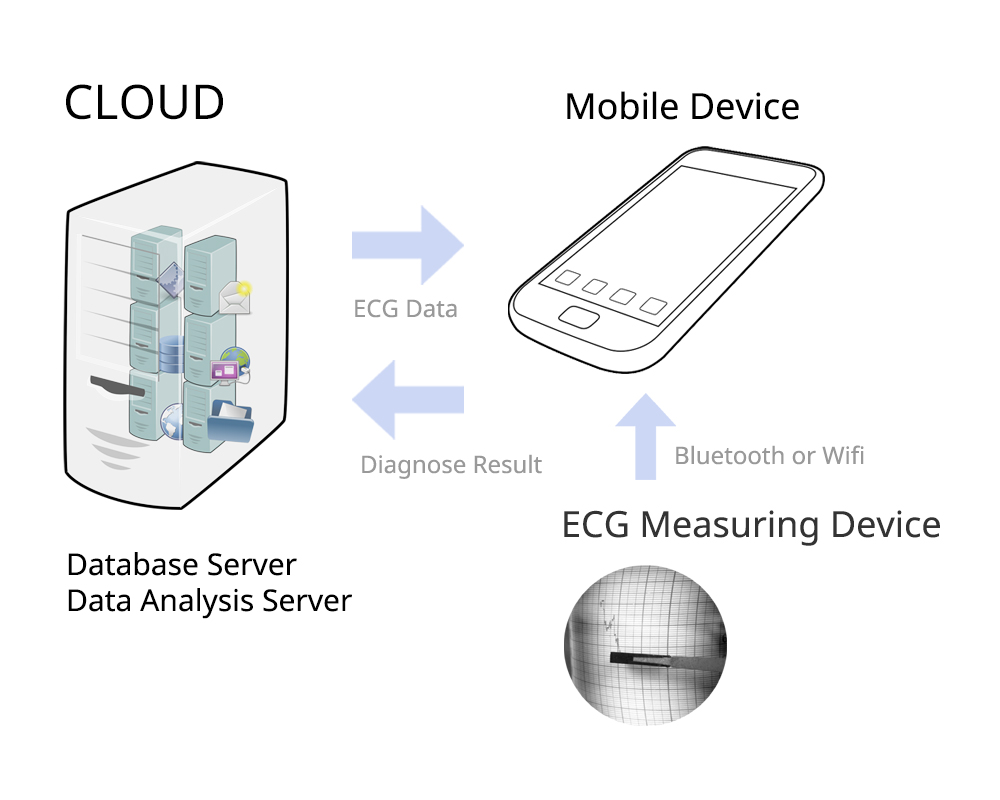
-> ECG data sent to the cloud continuously or intermittently for a long time performs statistical processing such as P wave time, PR, QRS, QT, QTc interval, and a warning is sent to the specialist to be diagnosed if meaningful changes are detected.
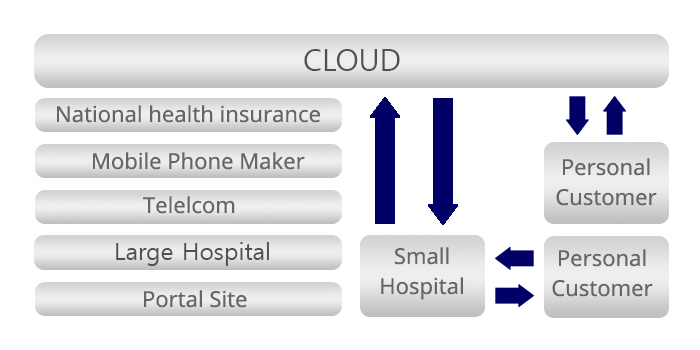
Connect with Gloval Platform Business
- The convergence of ICT and medical technologies is expected to bring about revolutionary changes in view of the enormous scale of network effects that follow.
-
Global companies such as Google, Amazon and Apple are competing in healthcare platform business, while Samsung Group in Korea is also seeking to do platform business through SAMI and Simband, etc.
These companies are choosing different platform businesses depending on whether they emphasize user convenience aspects or focus on platform roles for device and app developers, and which point they choose between fitness and full-fledged health care behavior. - The healthcare platform business is still in the preparatory stage due to institutional regulations on medical practices, lack of diagnostic algorithms and sensor technology. The ECG Monitoring System presented above can be a powerful tool for driving the platform business.
..
Future Tasks, Suggestions, and Others
Future Tasks
- In order to commercialize ECG analysis technology as a product, it is necessary to develop ECG measuring devices (mobile devices), cloud systems, and apps.
- It is desirable to develop devices and apps according to the design of the ECG Monitoring System.
-
The design of the ECG Monitoring System should take full account of the regulations and market conditions, etc. associated with medical practice.
For example, in Korea, telemedicine is legally prohibited and it is difficult to get a new concept of medical device certification. Therefore, if we set our current market as a starting point, the area of the monitoring system will be narrowed. In the case of the United States and Europe, telemedicine is allowed and will be as large as that. On the other hand, it is also possible to predict future changes and approach them from the perspective of preemptive investment. - For the efficient development processes, it is necessary for ECG experts or hospital organizations to participate in process.
- We hope to sell and transfer development technology and to participate partially in the development of the devices and apps required for the ECG Monitoring System to be built in the future.
- It is possible to sell only development technology, but in this case, we will go through a process of finding other buyers and choosing favorable conditions.
- The healthcare platform business is still in the preparatory stage due to institutional regulations on medical practices, lack of diagnostic algorithms and sensor technology. The ECG Monitoring System presented above can be a powerful tool for driving the platform business.
- Related to Market Outlook
- "The healthcare industry is worth $3.5 trillion within the United States alone and is still in the early stages of digital transformation." (Morgan Stanley Report; Maeil Business 4.9 2019)
- "Apple will post annual sales of $15 billion to $313 billion in healthcare by 2027" (Morgan Stanley Report; Daily Economy 4.9 2019)
- “The global market for smart healthcare will grow at an average annual rate of 42% from $800 million in 2015 to $ 6.6 billion in 2021” (Daily Bizon, 11.9 2018)
-
“The global market for ECG equipment will grow from $4.6 billion in 2017 to $8 billion in 2026.”
ref. https://www.inkwoodresearch.com/reports/ecg-equipment-market
- Related to Product Development
- AliveCor developed an ECG monitor in the form of a smartphone case, received FDA approval in 2012 and OTC approval in 2014. (OTC: Over-the-Counter, commonly purchasable without separate treatment or prescription)
- Apple released ‘Apple Watch 4’ in September 2018. The heart rate-based arrhythmia measurement and ECG measurement functions included here are FDA approved. (De Novo approved because the app was licensed)
- Korea’s start-up ’HUINO’ developed a smartwatch that can measure ECG in 2015 and they received approval from the Food and Drug Ministry for wearable ECG device ‘Memo Watch’ and artificial intelligence analysis software in March 2019.