Projects ECG (Electrocardiogram) Monitoring
Myocardial infarction

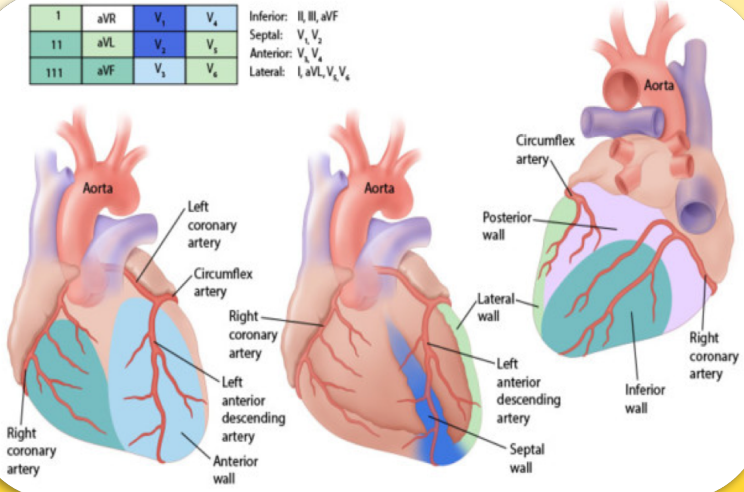
Fig.1 2017 March EMS CE (advocatehealth.com)
The diagnosis of myocardial infarction is covered in relative detail in The Minnesota Code Classification System.
Among the contents, a summary of Lead I is as follows.
Q and QS Patterns
Anterolateral site (leads I, aVL, V6)
1-1-1 Q/R amplitude ratio ≥ 1/3, plus Q duration ≥ 0.03 sec in lead I or V6.
1-1-2 Q duration ≥ 0.04 sec in lead I or V6.
1-1-3 Q duration ≥ 0.04 sec, plus R amplitude ≥ 3 mm in lead aVL.
1-2-1 Q/R amplitude ratio ≥ 1/3, plus Q duration ≥ 0.02 sec and < 0.03 sec in lead I or V6.
1-2-2 Q duration ≥ 0.03 sec and < 0.04 sec in lead I or V6.
1-2-3 QS pattern in lead I. Do not code in the presence of 7-1-1.
1-2-8 Initial R amplitude decreasing to 2 mm or less in every beat (and absence of codes 3-2, 7-1-1, 7-2-1, or 7-3 between V5 and
V6. (All beats in lead V5 must have an initial R> 2 mm.)
1-3-1 Q/R amplitude ratio ≥ 1/5 and < 1/3, plus Q duration ≥ 0.02 sec and < 0.03 sec in lead I or V6.
1-3-3 Q duration ≥ 0.03 sec and < 0.04 sec, plus R amplitude ≥ 3 mm in lead aVL
ST Junction (J) and Segment Depression
Anterolateral site (leads I, aVL, V6)
4-1-1 STJ depression ≥ 2.0 mm and ST segment horizontal or downward sloping in any of leads I, aVL, or V6.
4-1-2 STJ depression ≥ 1.0 mm but < 2.0 mm, and ST segment horizontal or downward sloping in any of leads I, aVL, or V6.
4-2 STJ depression ≥ 0.5 mm and < 1.0 mm and ST segment horizontal or downward sloping in any of leads I, aVL, or V6.
4-3 No STJ depression as much as 0.5 mm but ST segment downward sloping and segment or T-wave nadir ≥ 0.5 mm below P-R baseline, in any of leads I, aVL, or V6.
4-4 STJ depression ≥ 1.0 mm and ST segment upward sloping or U-shaped, in any of leads I, aVL, or V6.
T-Wave Items
Anterolateral site (leads I, aVL, V6)
5-1 T amplitude negative 5.0 mm or more in either of leads I, V6, or in lead aVL when R amplitude is ≥ 5.0 mm.
5-2 T amplitude negative or diphasic (positive-negative or negative-positive type) with negative phase at least 1.0 mm but not as deep as 5.0 mm in lead I or V6, or in lead aVL when R amplitude is ≥ 5.0 mm.
5-3 T amplitude zero (flat), or negative, or diphasic (negative-positive type only) with less than 1.0 mm negative phase in lead I or V6, or in lead aVL when R amplitude is ≥ 5.0 mm.
5-4 T amplitude positive and T/R amplitude ratio
The diagnosis of myocardial infarction can be considered to be determined by Q wave, J wave, and T wave morphology as described above. The following link explains the electrocardiogram in a way that is easy for the general public to understand, and is explained in relatively detail.
Q Wave • LITFL • ECG Library Basics
Pathological Q Waves
Q waves are considered pathological if:
> 40 ms (1 mm) wide
> 2 mm deep
> 25% of depth of QRS complex
Pathological Q waves usually indicate current or prior myocardial infarction.
Q waves involved only the anterior leads (V1-V4) in 13 patients: in all patients MI involved the anterior and anteroseptal walls and apex; 81% of scar tissue was within these regions. Q waves involved only the inferior leads (II, III, aVF) in 13 patients: in 12 of these patients MI involved the inferior and inferoseptal walls; however, only 59% of scar occupied these regions. Q waves involved only lateral leads (V5, V6, I, aVL) in 11 patients: in nine of these patients MI involved the lateral wall but only 27% of scar tissue was within this wall. Q waves involved two electrocardiogram locations in 42 patients. In the 79 patients as a whole, the number of anterior Q waves was related to anterior MI size (r=0.70); however, the number of inferior and lateral Q waves was only weakly related to MI size in corresponding territories (r=0.35 and 0.33). A tall and broad R wave in V1-V2 was a more powerful predictor of lateral MI size than Q waves. Finally, the number of Q waves accurately reflected the transmural extent of the infarction (r=0.70) only in anterior infarctions. 1)
Benign Early Repolarisation • LITFL • ECG Library Diagnosis
- ST / T wave ratio of > 0.25 suggests pericarditis
- ST / T wave ratio of < 0.25 suggests BER
Early repolarization (ER) and acute ST segment elevation myocardial infarction (STEMI) are sharing the pathophysiology of J wave syndromes. It is speculated that early ventricular arrhythmias (VAs) during STEMI may be predisposed by ER. Our aim was to study the association between ER pattern and risk of VAs during acute STEMI.2

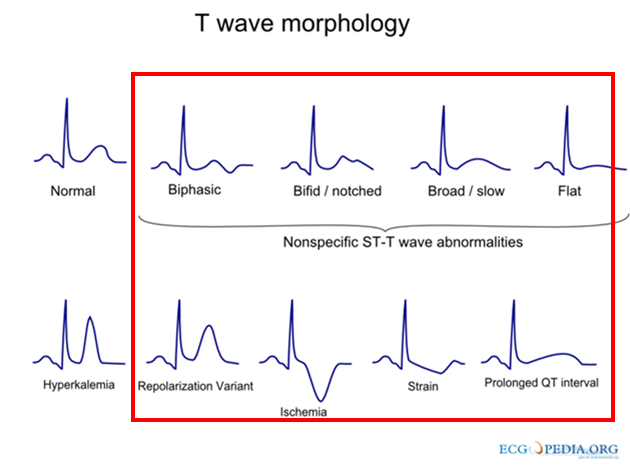
Fig.2 File:T wave morphology.png - ECGpedia
More than anything else introduced above, the easiest way to diagnose myocardial infarction in Lead I is the T wave
morphology.
In this post, I introduce a case where the diagnosis of myocardial infarction is impossible in Lead I based on Q wave, J
wave, and T wave morphology.
In my previous post, P wave duration and axis deviation, I introduced that in the s0066lre case, the biased angle of the
P wave's axis deviation is related to Myocardial infarction.

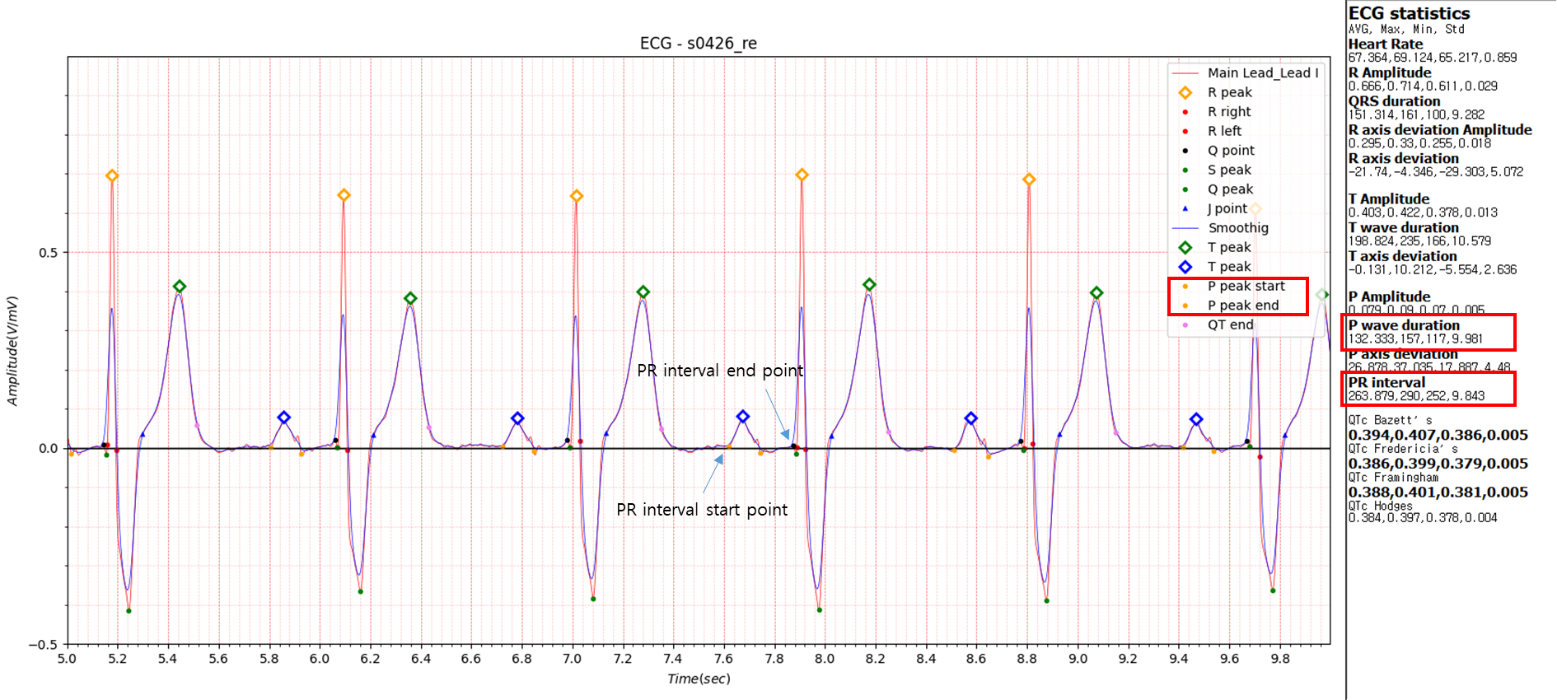
Fig.3 first-degree AV-block
- Reason for admission: Myocardial infarction
- Acute infarction (localization): no
- Former infarction (localization): inferior
- Additional diagnoses: Bundle branch block, Asthma bronchiale
The data S0426_re is Myocardial infarction with bundle branch block.
P wave duration
Average: 132.333, max: 157, Min: 117, std: 9.981
PR interval
Average: 263.879, max: 290, Min: 252, std: 9.843
The following link explains that anything over 220ms is a first-degree AV-block.
ECG interpretation: Characteristics of the normal ECG (P-wave, QRS complex, ST segment, T-wave) – Cardiovascular Education
The most common cause of first-degree AV-block is degenerative(age-related) fibrosis in the conduction system.
Myocardial ischemia/infarction and medications (e.g. beta-blockers) may also cause first-degree AV-block.
Looking at another paper:
PR prolongation strongly predicts new-onset ischemic stroke, MI, cardiovascular death, and combined cardiovascular
endpoint including CHF in coronary patients or risk equivalent.2.
QT interval prolongation is often observed in the electrocardiogram of patients with myocardial infarction. QT interval
prolongation as predictor of sudden death in patients with myocardial infarction.
Fig. 3 S0426_re data has no peculiarities in Q wave, J wave, T wave morphology and QT interval prolongation. However,
abnormal elements P wave duration and P wave duration were measured in P wave.
I am trying to diagnose myocardial infarction with a single Lead I lead, but Lead I alone cannot be measured with a
single lead measurement system such as a smartwatch.
A method of measuring a 12-lead electrocardiogram using a smartwatch has been introduced on the Internet.
If the results show that myocardial infarction is suspected due to the abnormality of the P wave introduced above,
misdiagnosis can be avoided by inducing re-measurement using a different lead.
References
1. Q-wave prediction of myocardial infarct location, size and transmural extent at magnetic resonance imaging - PubMed
2. Early Repolarization Pattern Is Associated with Increased Risk of Early Ventricular Arrhythmias during Acute ST Segment Elevation Myocardial Infarction - PMC
3. PR interval prolongation in coronary patients or risk equivalent: excess risk of ischemic stroke and vascular pathophysiological insights - PMC
4. The predictive value of P-wave duration by signal-averaged electrocardiogram in acute ST elevation myocardial infarction - PubMed