Projects ECG (Electrocardiogram) Monitoring
Myocardial infarction II
I covered the general content of myocardial infarction in Myocardial infarction I.
In this post, I look at the ECG changes immediately after the occurrence of myocardial infarction and after it has
stabilized for the four types: lateral, anterior, inferior, and antero-lateral.
The reason I am interested in myocardial infarction is because I believe that what patients who have myocardial
infarction most desperately need is electrocardiogram monitoring. It is very important to inform users in advance of the
risk of myocardial infarction through continuous electrocardiogram monitoring.
The purpose of this post is to collect backdata to determine whether the user has already experienced Myocardial
infarction in the ECG monitoring software when the user monitors the ECG.
1. lateral
patient043
- age: 52
- sex: female
- Reason for admission: Myocardial infarction
- Acute infarction (localization): lateral
- Former infarction (localization): no
- Additional diagnoses: Hyperlipoproteinemia Type IIa, Arterial hypertension, Ventricular fibrillation
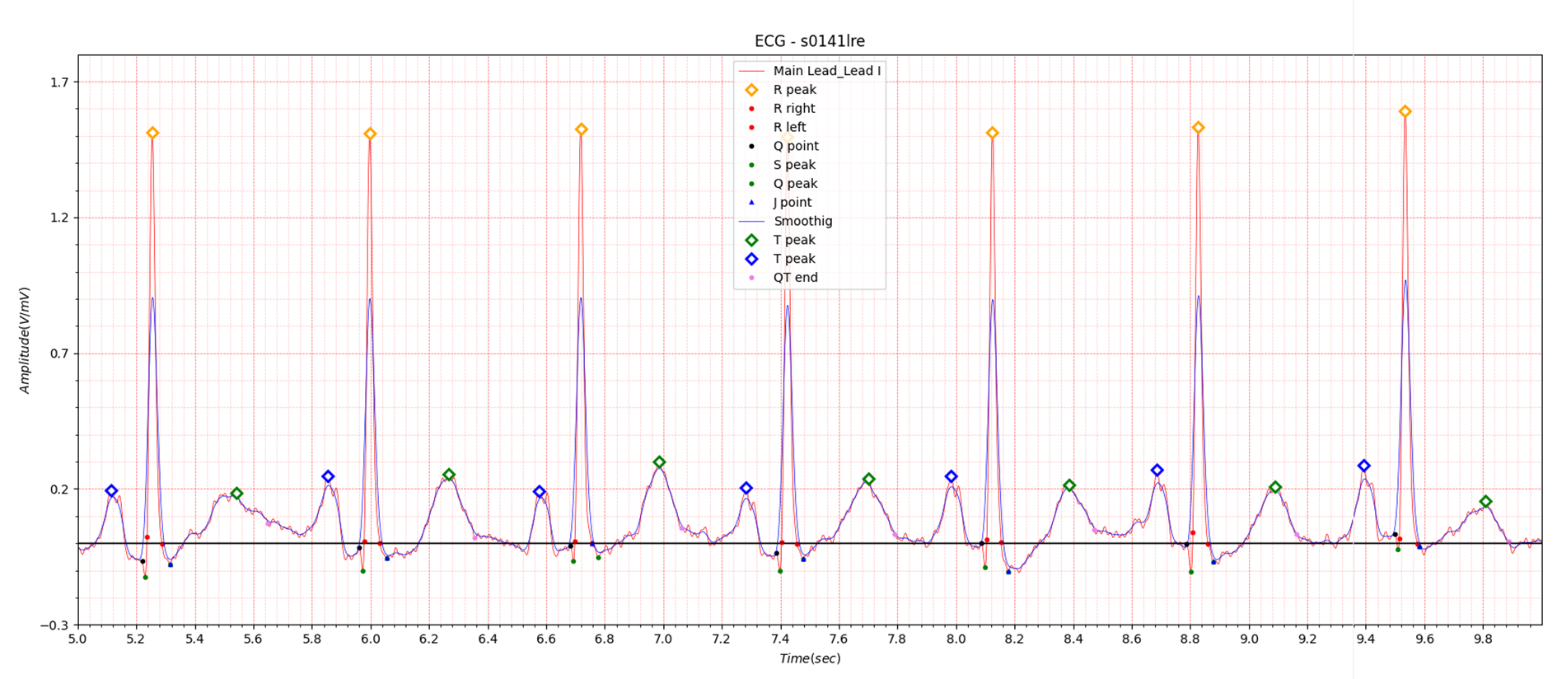
Fig.1 patient043: ECG date: 11/03/1991
It is very unfortunate that there is only one case of lateral in the PTB database.
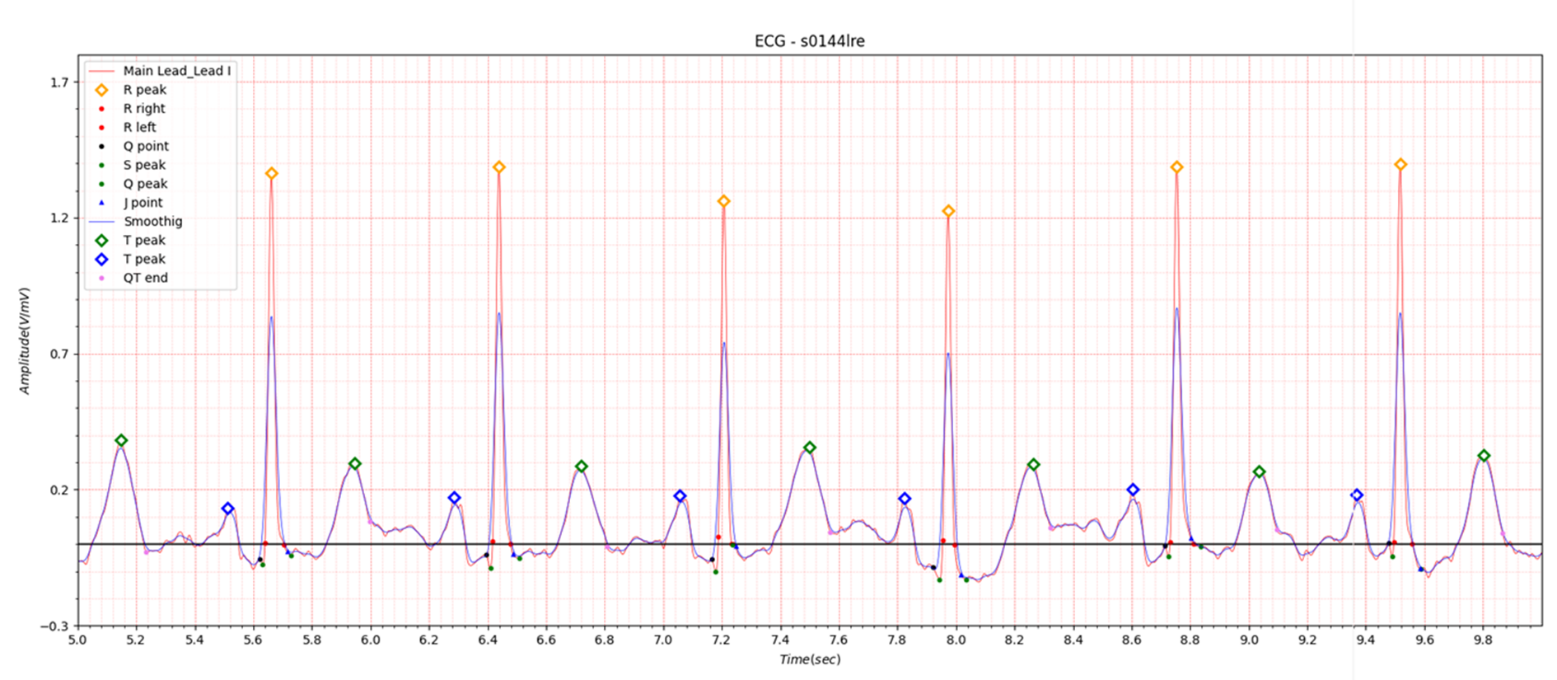
Fig.2 patient043: ECG date: 18/03/1991
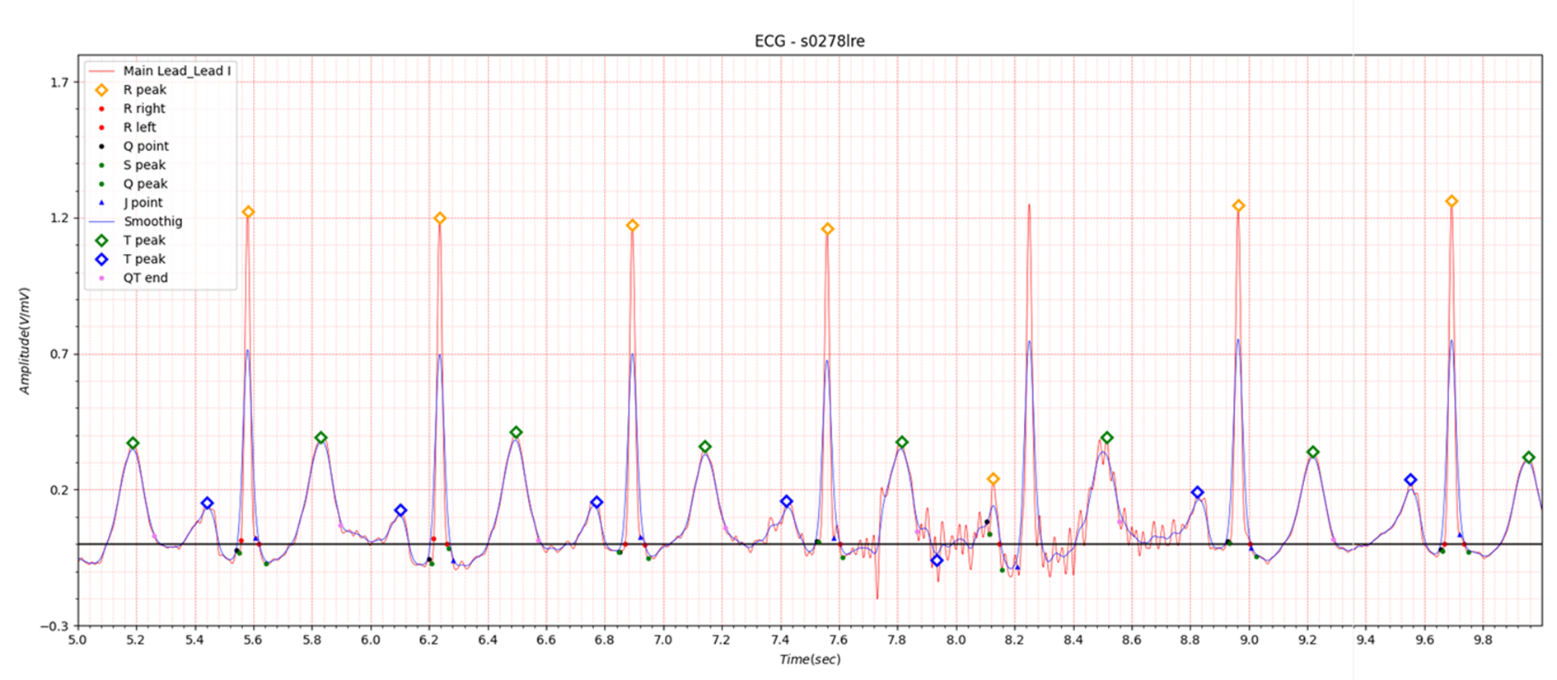
Fig.3 patient043: ECG date: 23/03/1992
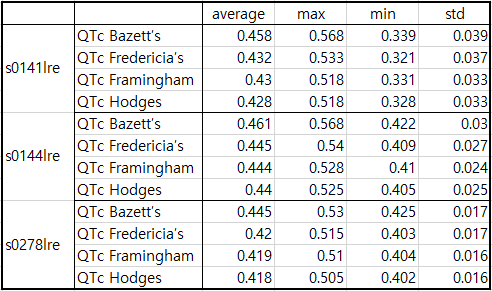
Table1. patient043
In Lead I, very slight ST elevation of about 0.05 to 0.1 is seen in the situation of STEMI. In the case of ST depression, depression of about -0.05 to -0.1 is observed. Table 1 shows that at the beginning of MI, QTc slightly increased from 0.458 to 0.461 and then stabilized at 0.445. It is also observed in Fig. 1, Fig. 2, and Fig. 3.
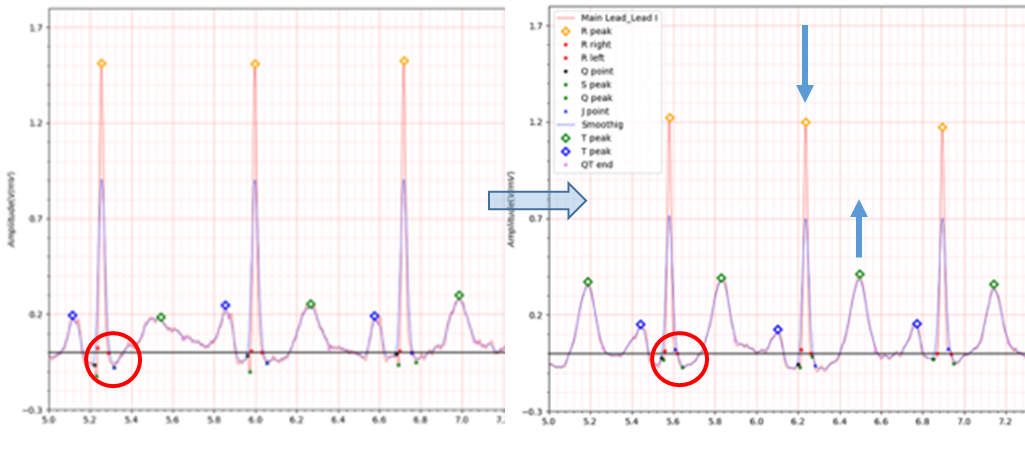
Fig.4 ECG date: 11/03/1991 -> ECG date: 23/03/1992
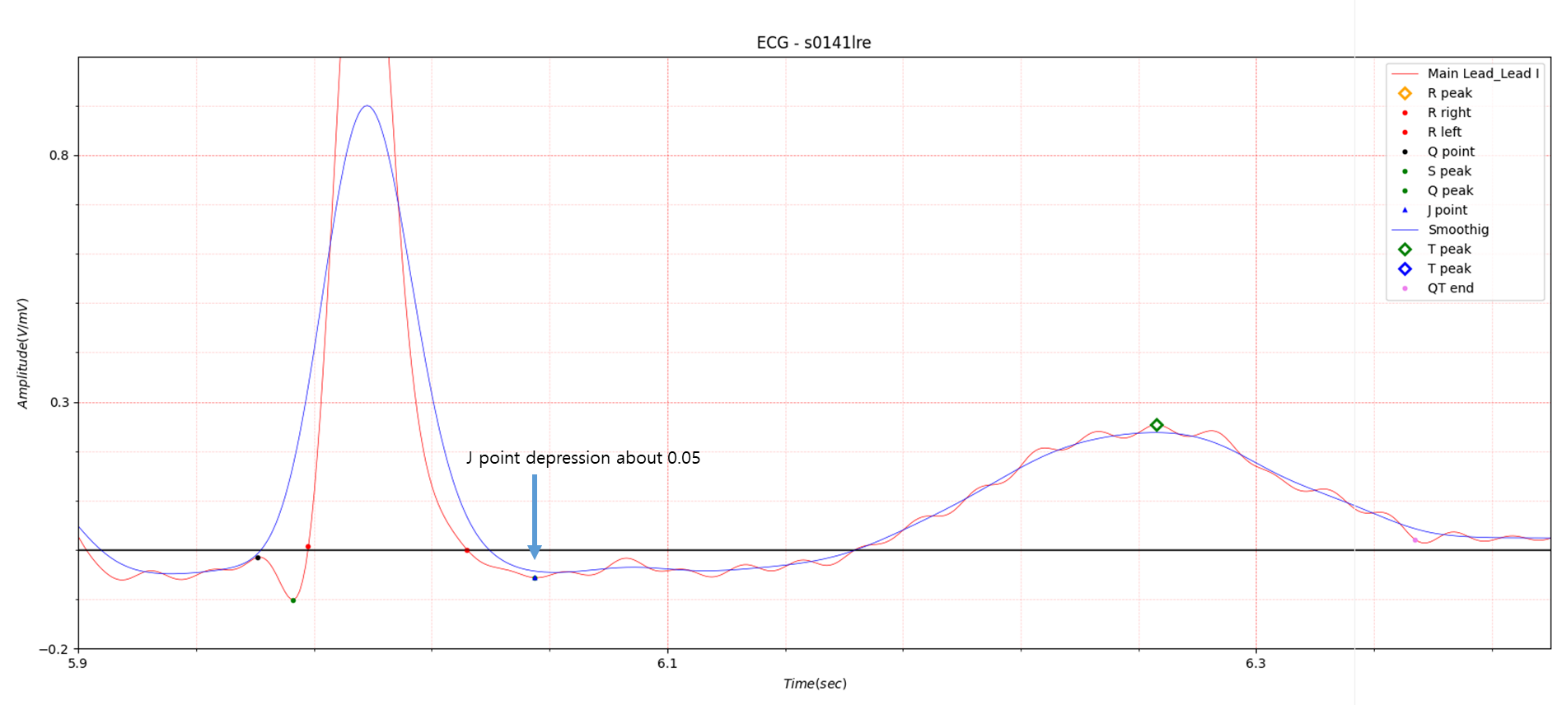
Fig.5 patient043: ECG date: 23/03/1992
2. anterior
- age: 74
- sex: male
- ECG date: 24/10/1990 Infarction date (acute): 23-Oct-90
- Diagnose:
- Reason for admission: Myocardial infarction
- Acute infarction (localization): anterior
- Former infarction (localization): no
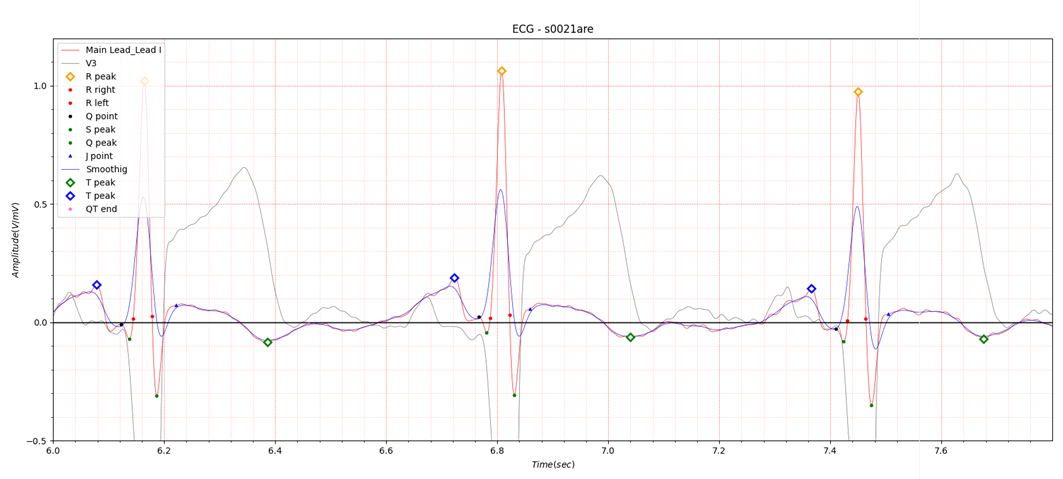
Fig.6 patient005 ECG date: 24/10/1990
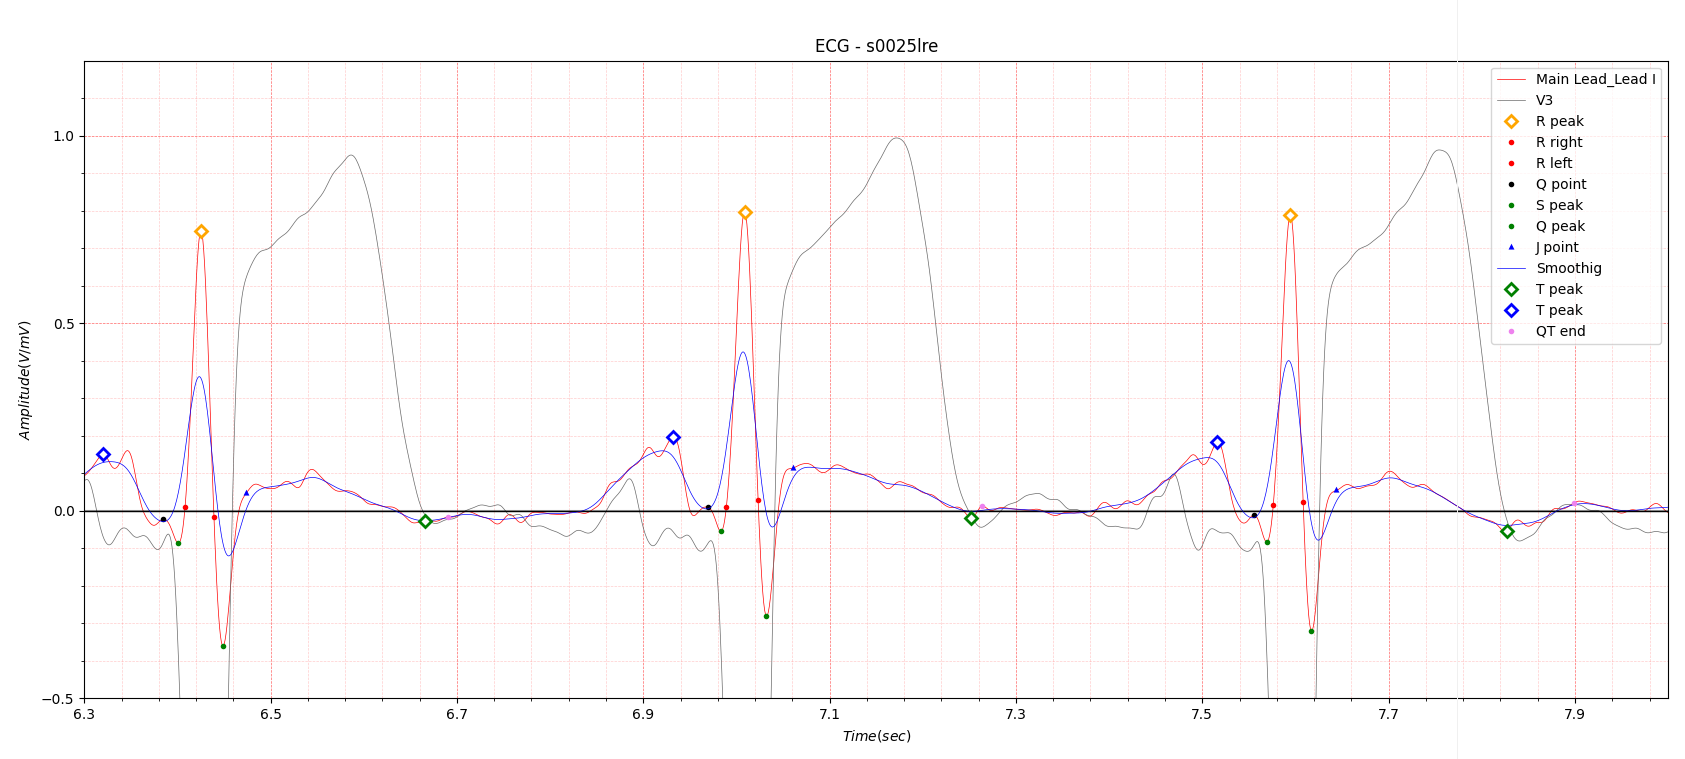
Fig.7 patient005 ECG date: 25/10/1990
In the anterior location, ST elevation is most evident in lead V3.
Infarction date (acute): 23-Oct-90, the following day, 25/10/1990, the electrocardiogram in Fig.6 was recorded.
It appears that there was no time to record an electrocardiogram for research purposes in an emergency situation.
Fig.7 shows the ECG recording date of 25/10/1990. ST elevation is much higher than in Fig.6.
As I am a signal analysis expert, I do not know why the ST elevation increased two days after the MI occurred.
In Fig.7, the T wave peak point is marked with a green diamond, but it may look awkward. In order to accurately find
the end point of QT duration, I marked the T wave peak point using a morphology I devised myself.
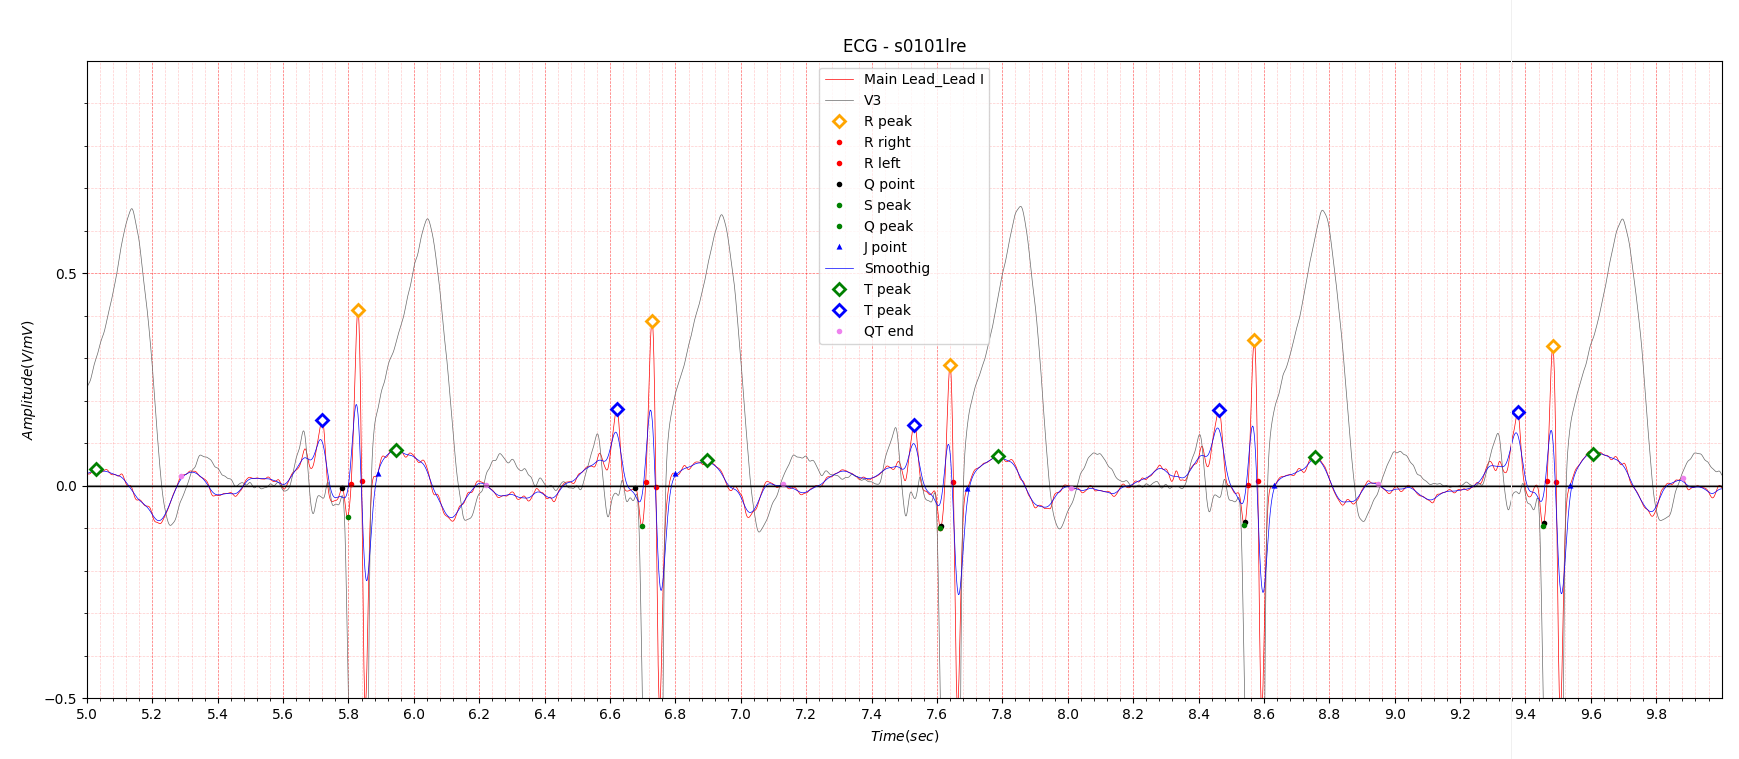
Fig.8 patient 005 17/01/1991
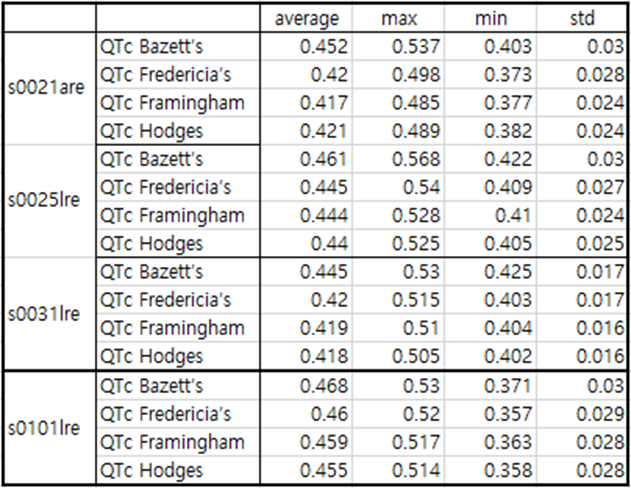
Table 2. patient005
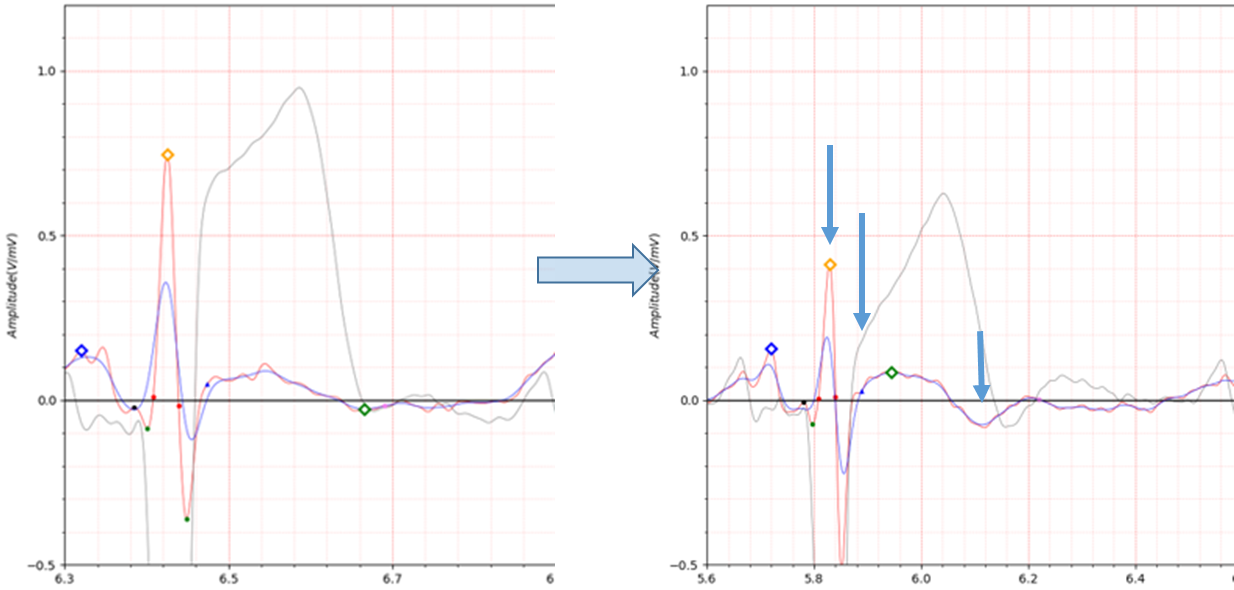
Fig.9 patient005 25/10/1990 -> 17/01/1991
3. inferior
- age: 62
- sex: female
- ECG date: 07/11/1990
- Diagnose:
- Reason for admission: Myocardial infarction
- Acute infarction (localization): inferior
- Former infarction (localization): no
- Additional diagnoses: Arterial hypertension

Fig.10 patient011 07/11/1990
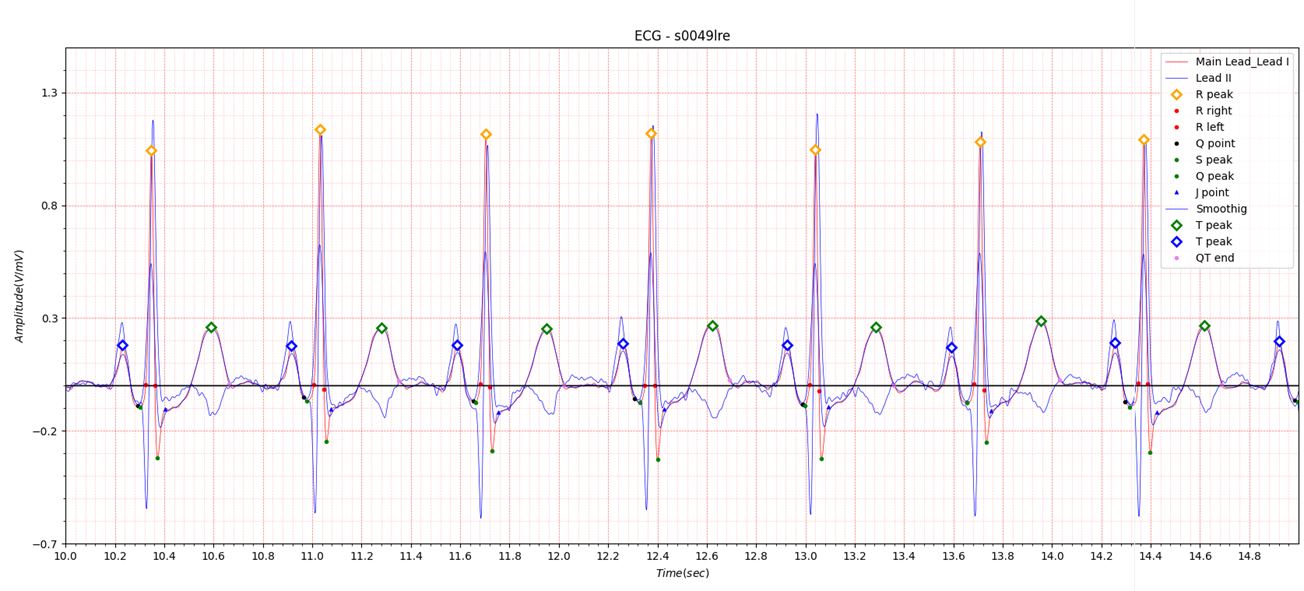
Fig.11 patient011 17/11/1990
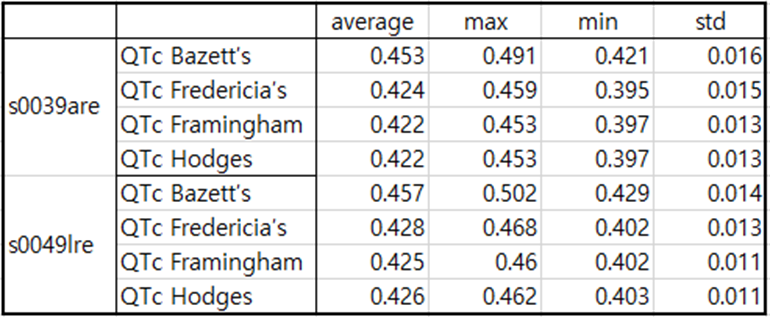
Table3. patient011
In the inferior position, a deep Q point can be seen in lead II as shown in Figures 10 and 11.
In Lead I, there is a lot of ST depression.
4. antero-lateral
- age: 64
- sex: male
- ECG date: 08/05/1991
- Diagnose:
- Reason for admission: Myocardial infarction
- Acute infarction (localization): antero-lateral
- Former infarction (localization): no
- Additional diagnoses: no
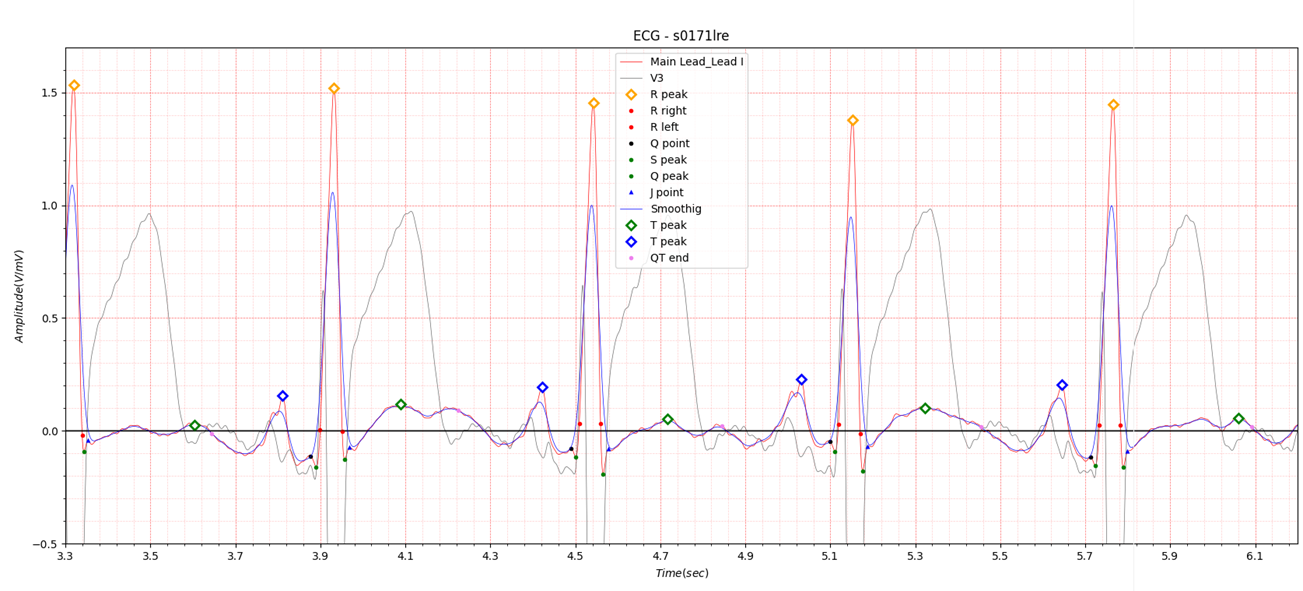
Fig.12 patient048 08/05/1991
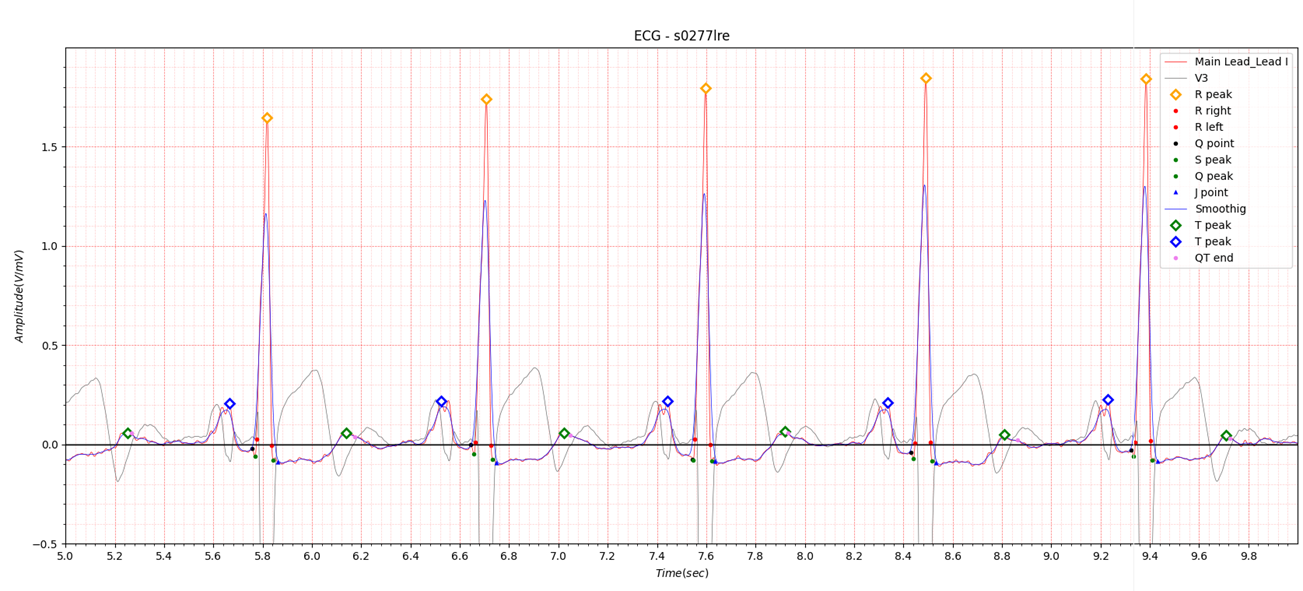
Fig.13 patient048 23/03/1992
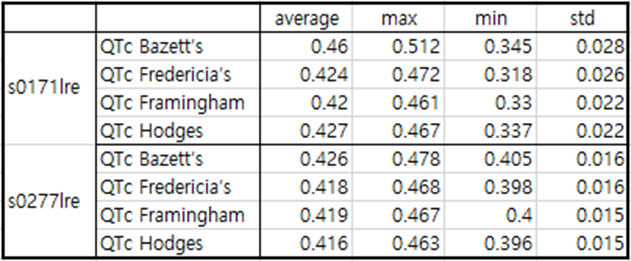
Table4. patient048
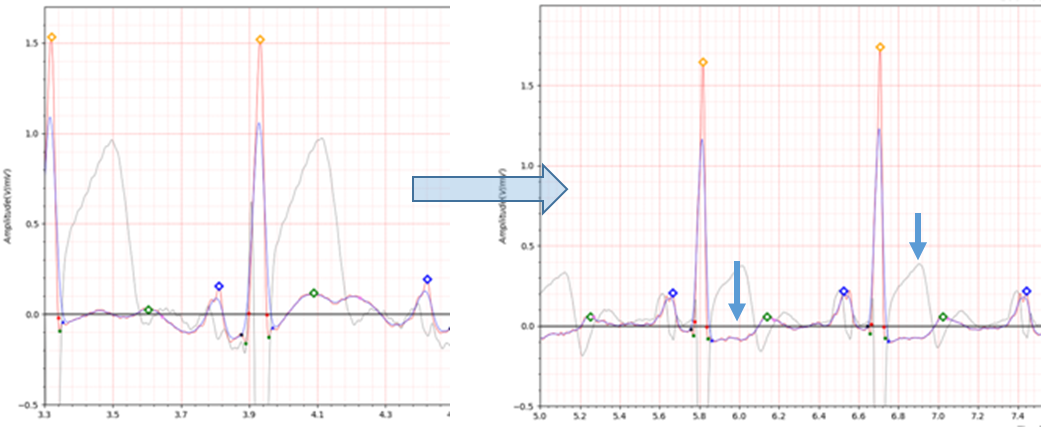
Fig.14 patient048 08/05/1991 -> 23/03/1992
The antero-lateral position has similar characteristics to the lateral position.