Projects ECG (Electrocardiogram) Monitoring
ECG analysis using Hilbert transform - P/R/T peak detect
Summary
Development of an analytical method that accurately measures various indexes (PQRST cycle
and size) necessary for ECG (Electrocardiogram) diagnosis and processes them to quantified values.
Classify data in commonly used methods
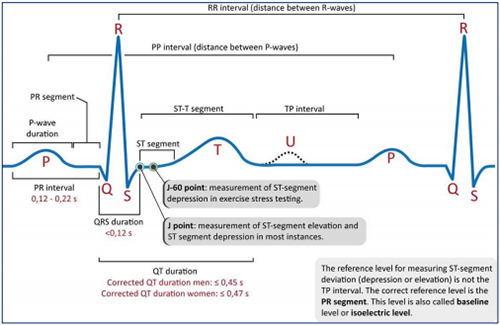
Noise elimination with filtering technique such as Highpass
Filtering
Actual ECG signals contain a lot of noise, which interfere with the accurate
detection of Q R S peaks, etc.
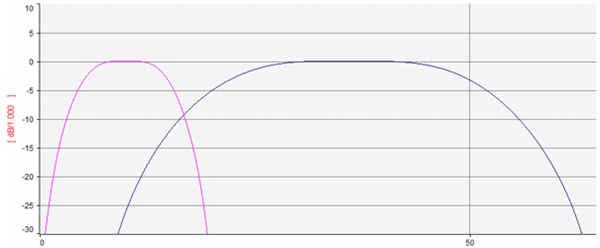
Noise elimination by designing and applying appropriate filters step
by step.
- Example of Filter Design
Calculate ECG diagnosis elements into digitized data by converting ECG signals
into
Hilbert to obtain Nyquist diagram and applying Circle Fitting.
Many studies have been done to develop algorithms for ECG peak detection, but show
limitations on unstable signals.
Identify the ECG diagnosis elements accurately using the Hilbert
transformation
method, and solve the problem by deriving it using digitized data methods.(related part
is
applied for PCT patent)
- Examples of Traditional algorithm research
Detection Algorithm for ECG using Double Difference and RR Interval
Processing
d1(i) = e(i+1) - e(i), i = 1,2... n-1
d2(j) = d1(j+1) - d1(j), j = 1,2... n-2
d(j) = [d2(j)]2
- Test results for some diseased patients
| LEADS | Ⅰ | Ⅱ | Ⅲ | aVR | aVL | aVF | V1 | V2 | V3 | V4 | V5 | V6 |
|---|---|---|---|---|---|---|---|---|---|---|---|---|
| Total R | 507 | 507 | 507 | 507 | 507 | 507 | 507 | 507 | 507 | 507 | 507 | 507 |
| Detected R | 507 | 505 | 506 | 506 | 504 | 506 | 506 | 505 | 506 | 506 | 506 | 506 |
| TP | 507 | 505 | 506 | 506 | 504 | 506 | 506 | 506 | 506 | 506 | 506 | 506 |
| FN | 0 | 2 | 1 | 1 | 3 | 1 | 1 | 2 | 1 | 1 | 2 | 1 |
| Sensitivity(%) | 100 | 99.6 | 99.8 | 99.8 | 99.4 | 99.8 | 99.8 | 99.6 | 99.8 | 99.8 | 99.8 | 99.8 |
The overall detection sensitivity is
99.8%.
Detection of false peak is almost negligoble. The algorithm shows good performance
for
data affected with
low frequency noises like base-line wander.
ref. :
https://www.sciencedirect.com
- R Peak Detection by existing method (example of a normal signal)

-> For normal signals, R peak detection shows excellent results.
-> Here, the peak is detected for values greater than 0.2.

-> It shows inappropriate results for unstable signals. Applying a 0.2 (threshold) value, as shown above, will result in missing peak and lowering the threshold hold value will result in too many peaks being detected.

■ ECG Graph
■ Complete R peak detection results using improved filters and Hilbert transformations
two-time differential for peak detection is generally employed, and the study above
suggests
that detection sensitivity is 99.8%, but only for normal signals. The two-time
differential
method has limitations in detecting the correct peak for unstable
signals.
- Hilbert Conversion of ECG Signals

-> If you convert an ECG signal to Hilbert, you can obtain an imaginary part of the signal. The pink graph is the imaginary part of the ECG.
- Nyquist Diagram
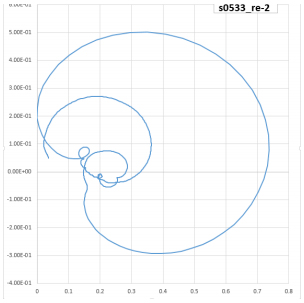
-> If Imaginary part data obtained by ECG data and Hilbert transformation is drawn in X-Y Graph format, it is as above. This is called the Nyquist diagram.
- Circle Fitting and Calculating Numerical Data
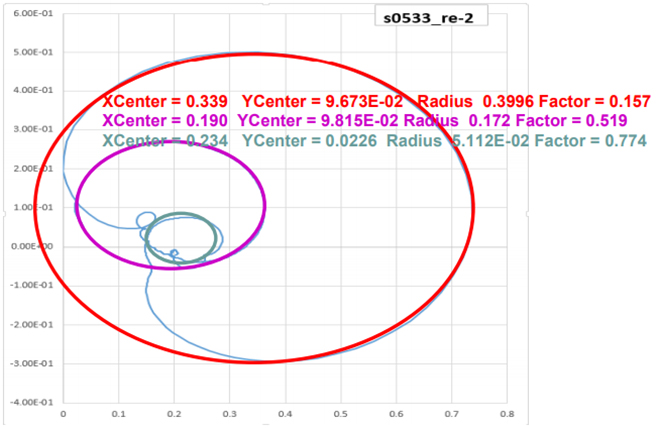
-> Circle fitting the P R T peak from the Nyquist diagram and obtain the diameter of each part.
-> The diameter of the circle corresponds to the amplitude of P R T.
- Hilbert Transformation, Nyquist Diagram and 3D ECG
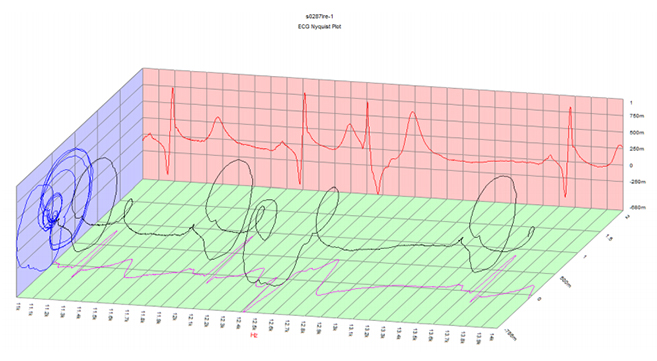
■ (Rear) : An imaginary graph obtained by Hilbert conversion
■ (floor) : raw ECG graph
■ (left-hand side) : Nyquist Black: 3D ECG Graph