Projects ECG (Electrocardiogram) Monitoring
P wave duration and axis deviation
Detecting the P peak in a single lead can sometimes be quite difficult. This is the case when the P wave is reversed or
the isoelectric line falls and the P peak falls below 0.
In this post, I would like to introduce P wave duration and P axis deviation using the case of an ECG diagnosed as
Myocardial infarction and an ECG diagnosed as not having cardiomyopathy.
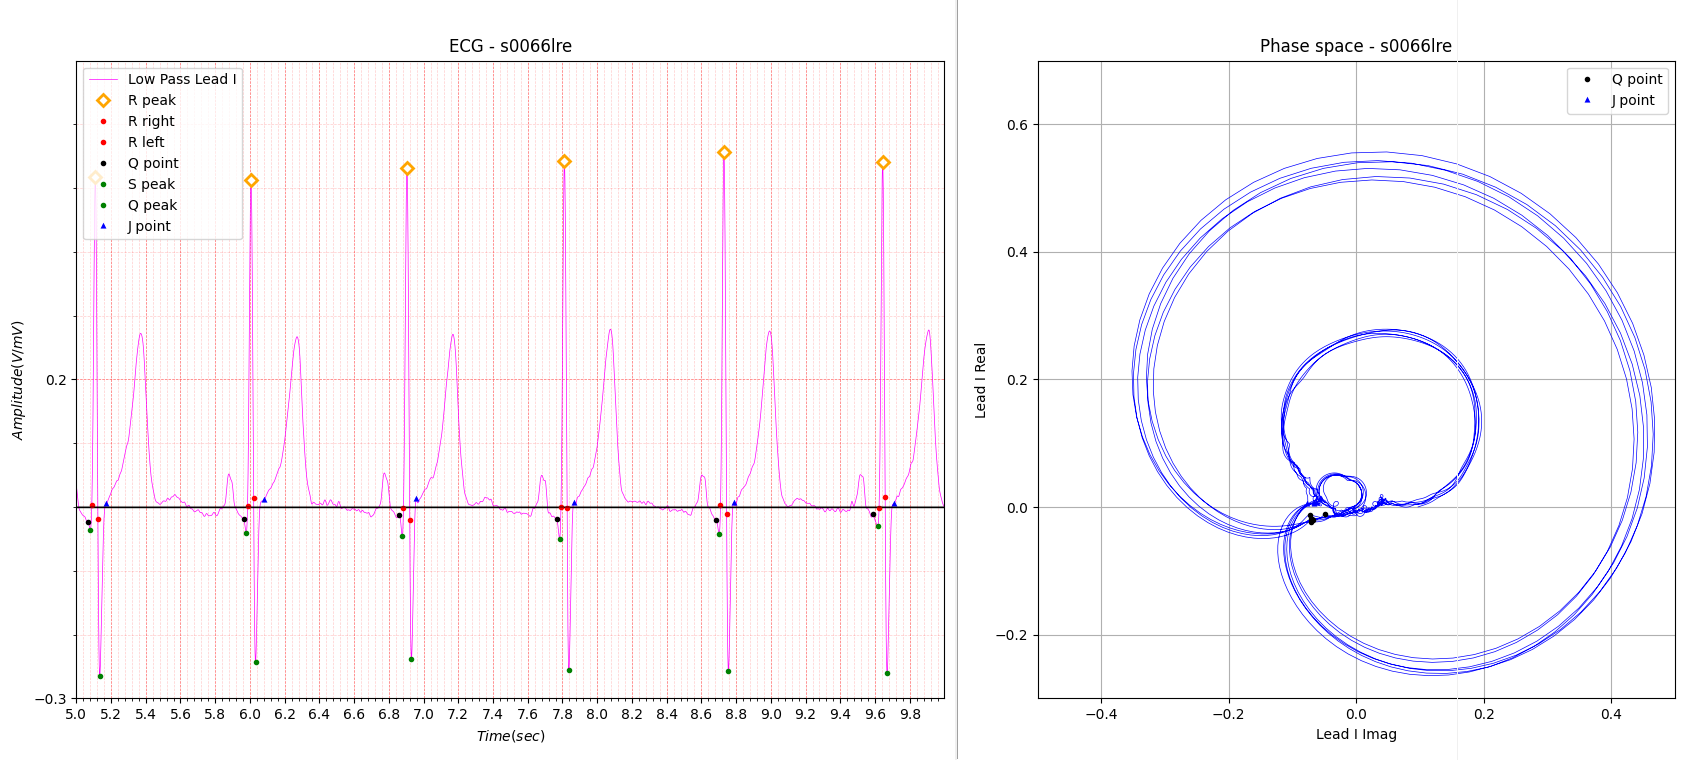
Fig.1 Myocardial infarction
R axis deviation Amplitude: 0.239, 0.262, 0.213, 0.014
R axis deviation Angle: 3.014, 16.99, -8.577, 6.733
The diagnosis results for Fig. 1 are as follows.
- Reason for admission: Myocardial infarction
- Acute infarction (localization): infero-lateral
- Former infarction (localization): no
- Additional diagnoses: Arterial hypertension, Hypercholesterinemia
When I first saw the electrocardiogram in Fig. 1, I was deeply troubled.
This is because the various signs commonly seen in myocardial infarction were not seen at all.
Of course, diagnosis is easy if all 12 leads are used, but since it was believed that diagnosis of myocardial infarction
was possible even with a single lead, that belief was shattered with this one ECG.
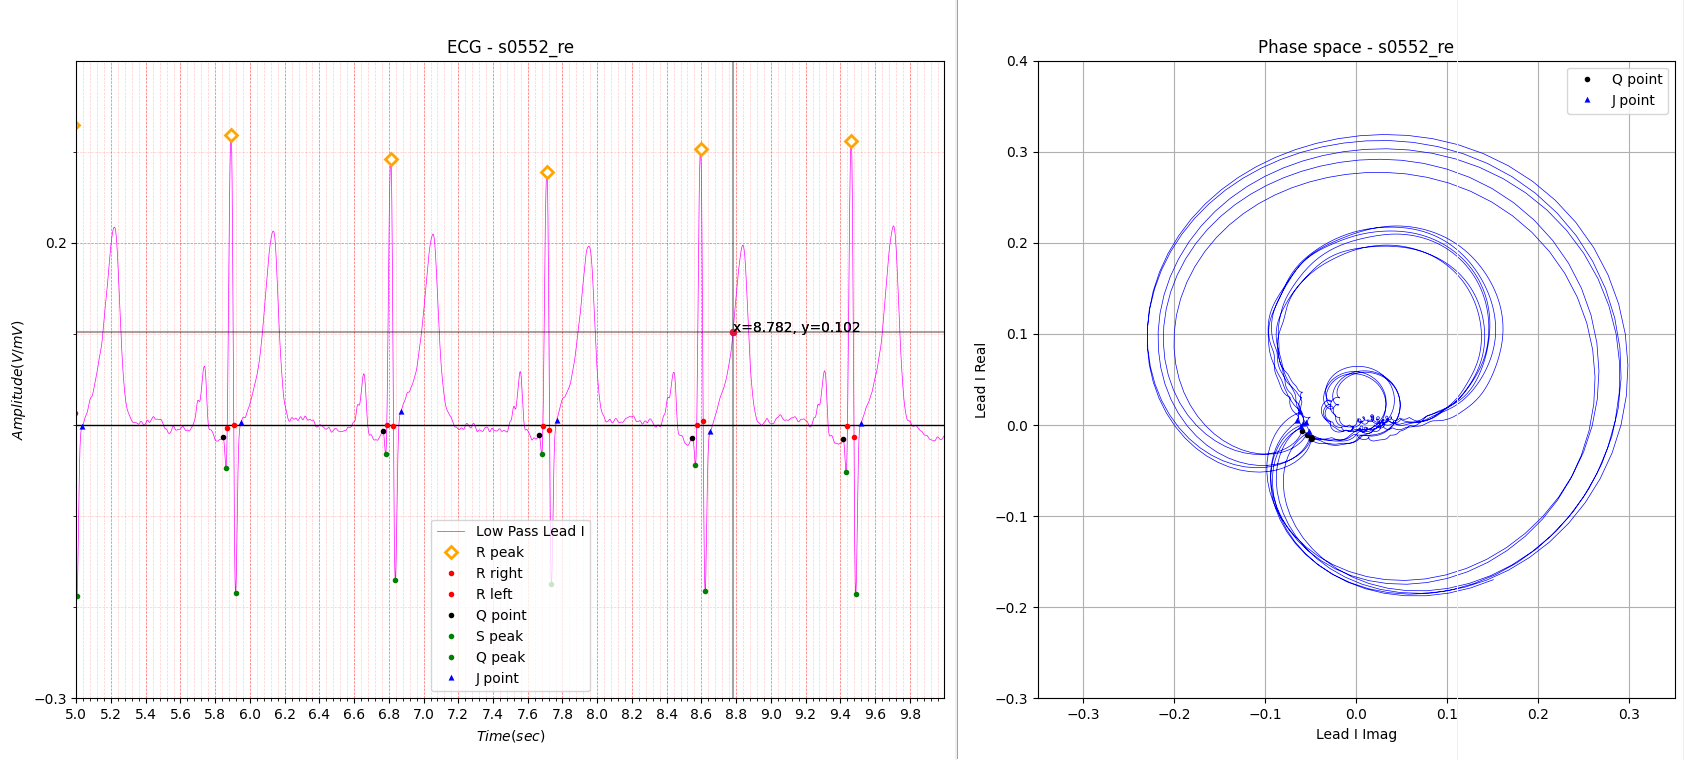
Fig.2 Healthy control
The ECG in Fig.2 resembles the ECG in Fig.1 almost like a twin.
In the phase space on the right side of Fig.1 and 2, the R wave and T wave look similar to each other, but the P wave
part is clearly different.

Fig.3 Peaks
Fig.3 shows P peaks. Cases where either the left or right atrial were reversed or biphasic were omitted.
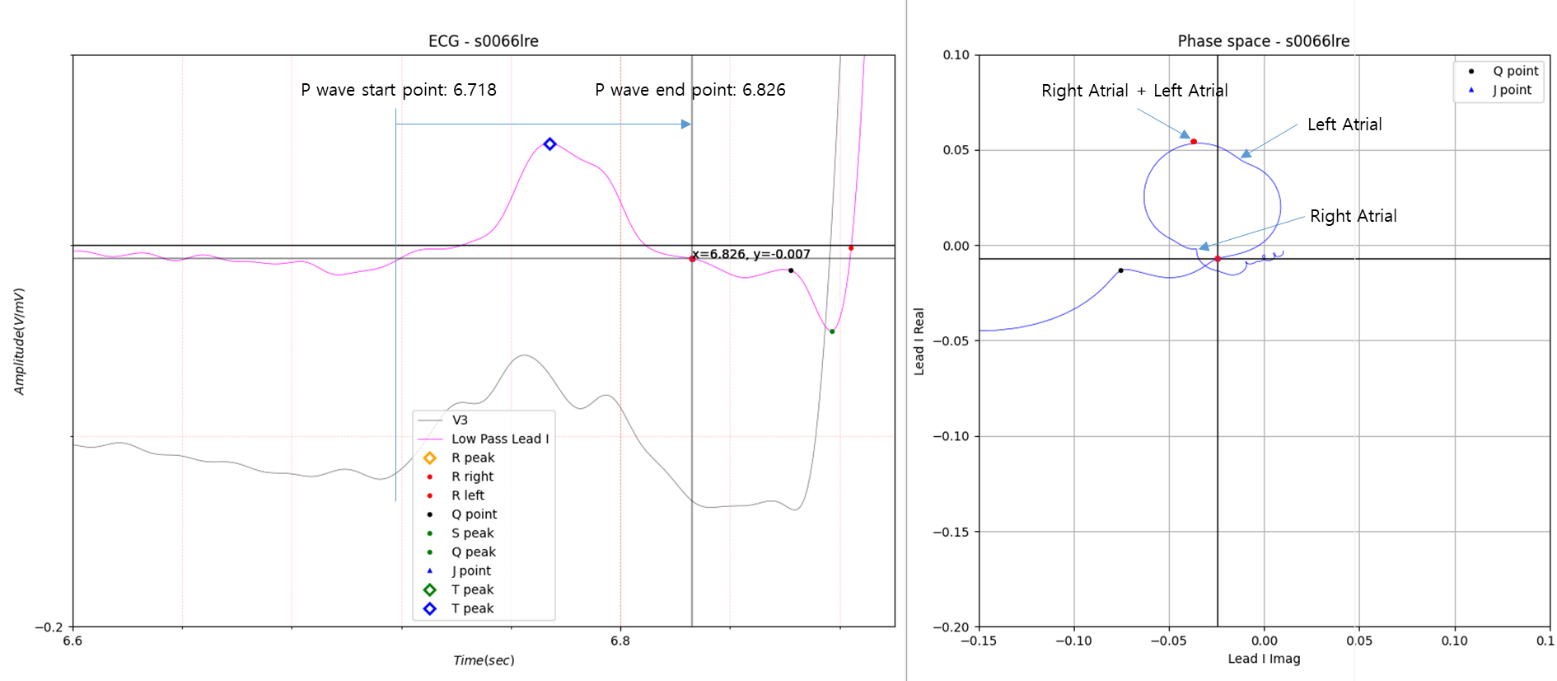
Fig.4 P peak of Myocardial infarction
In Fig.4, there is only one P peak in Lead I. However, in V 3, three peaks appear clearly. You can see the bulge on the right side of Lead I P peak. If you look at the phase space on the right side of Fig.4, you can see that the raised part of the left graph is slightly dented. The same goes for the left side of the P peak.
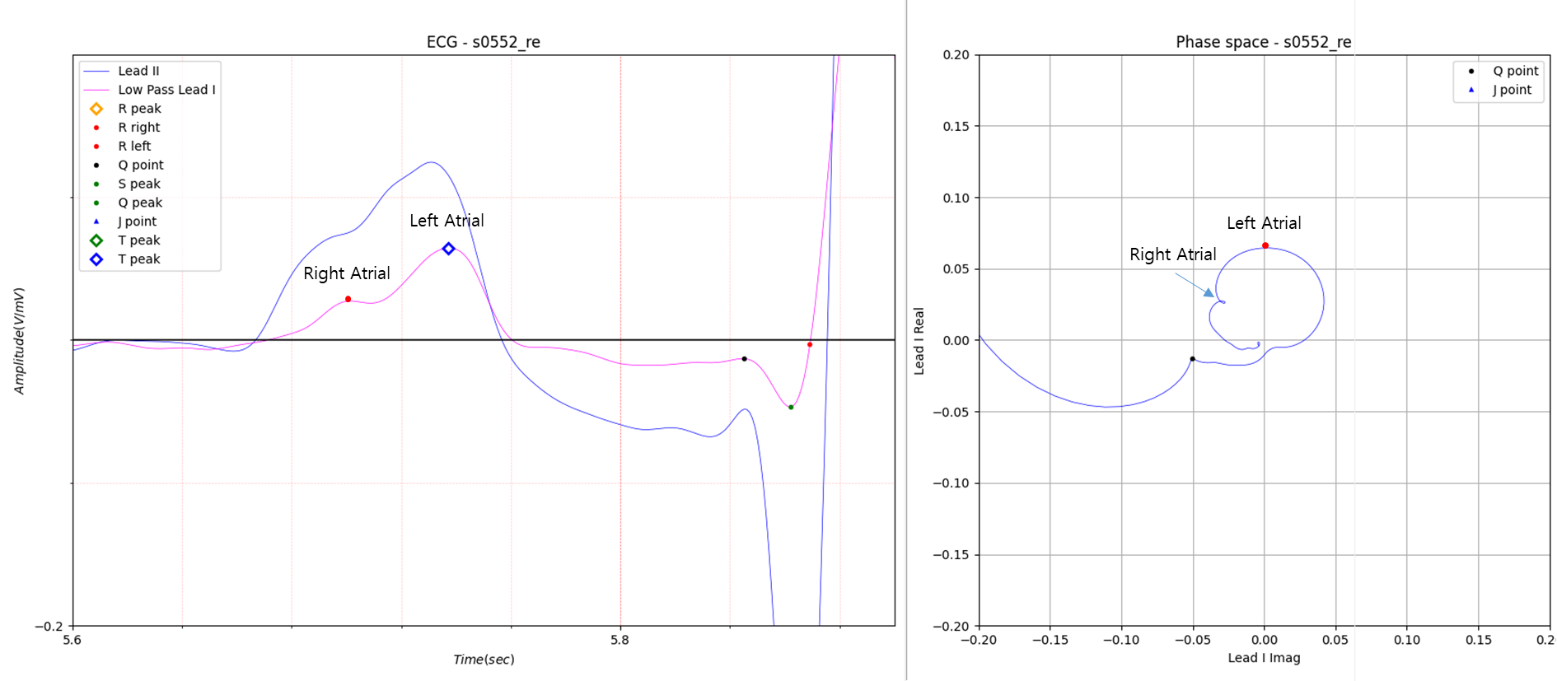
Fig.5 P peak of Healthy control
Fig.5 is the P peak of an electrocardiogram without cardiomyopathy.
The electrocardiogram of Lead I has two peaks.
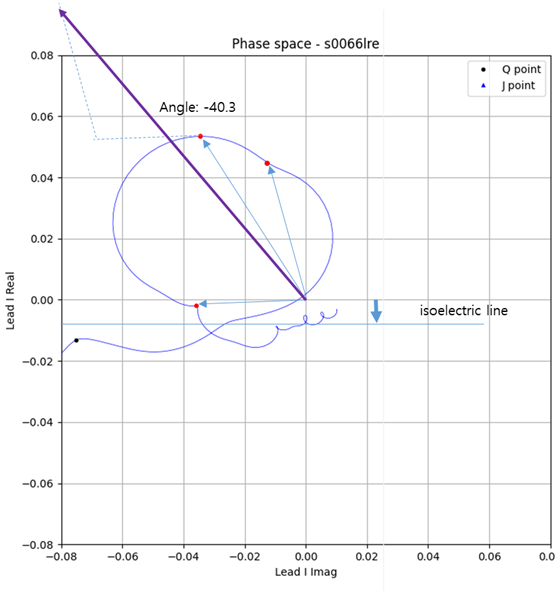
Fig.6 P axis deviation of Myocardial infarction
Max: 118, Min: 99, avg: 109.9, std: 4.659
Statistics for all P peaks are as follows.
P wave axis deviation:
Max: -30.5, Min: -61.4, Avg: -39.305, std: 5.464
The P axis deviation in Figure 6 obtained the vector sum of the P peak, including the peak of the imaginary part in
Figure 4, and expressed the slope of the vector sum as P axis deviation.
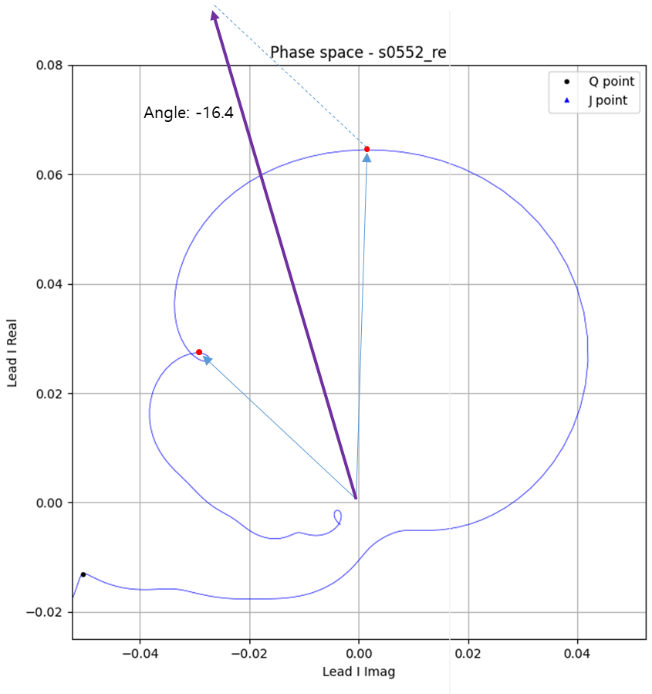
Fig.7 P axis deviation of Healthy control
P wave axis deviation:
Max: 27.3, Min: -35.0, Avg: -5.09, std: 13.114>
The electrocardiogram in Fig. 5 has the same P axis deviation as Fig. 7, but the standard deviation was large.
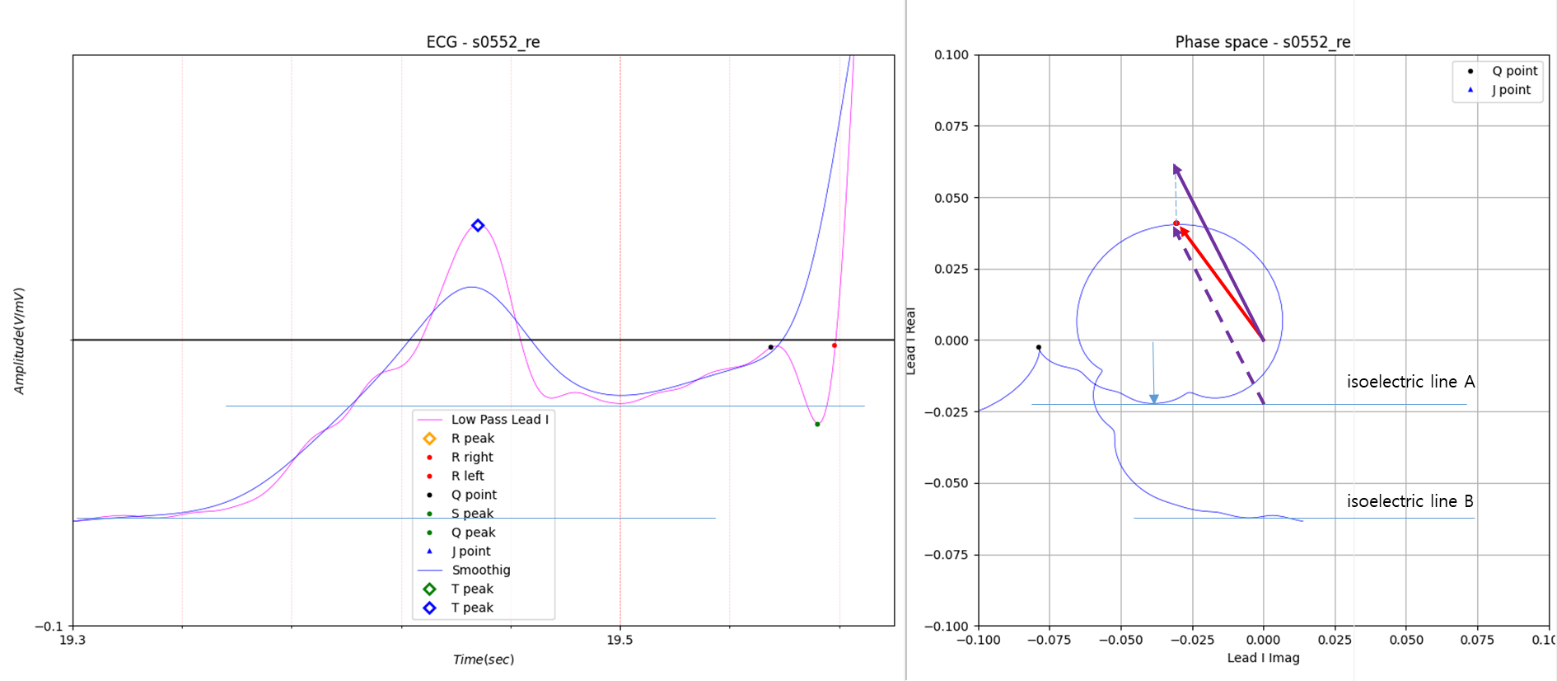
Fig.8 Unusual type P peak of Healthy control 1
Red line angle: -35.0
Violet line angle: -24.5
The reason why the standard deviation was large was because the results shown in Figure 8 were obtained at 4 out of 35
total P peaks. As shown in Figure 8, when P peak falls, a little more consideration is needed as to whether the vector
should be compensated along the isoelectric lines A and B.
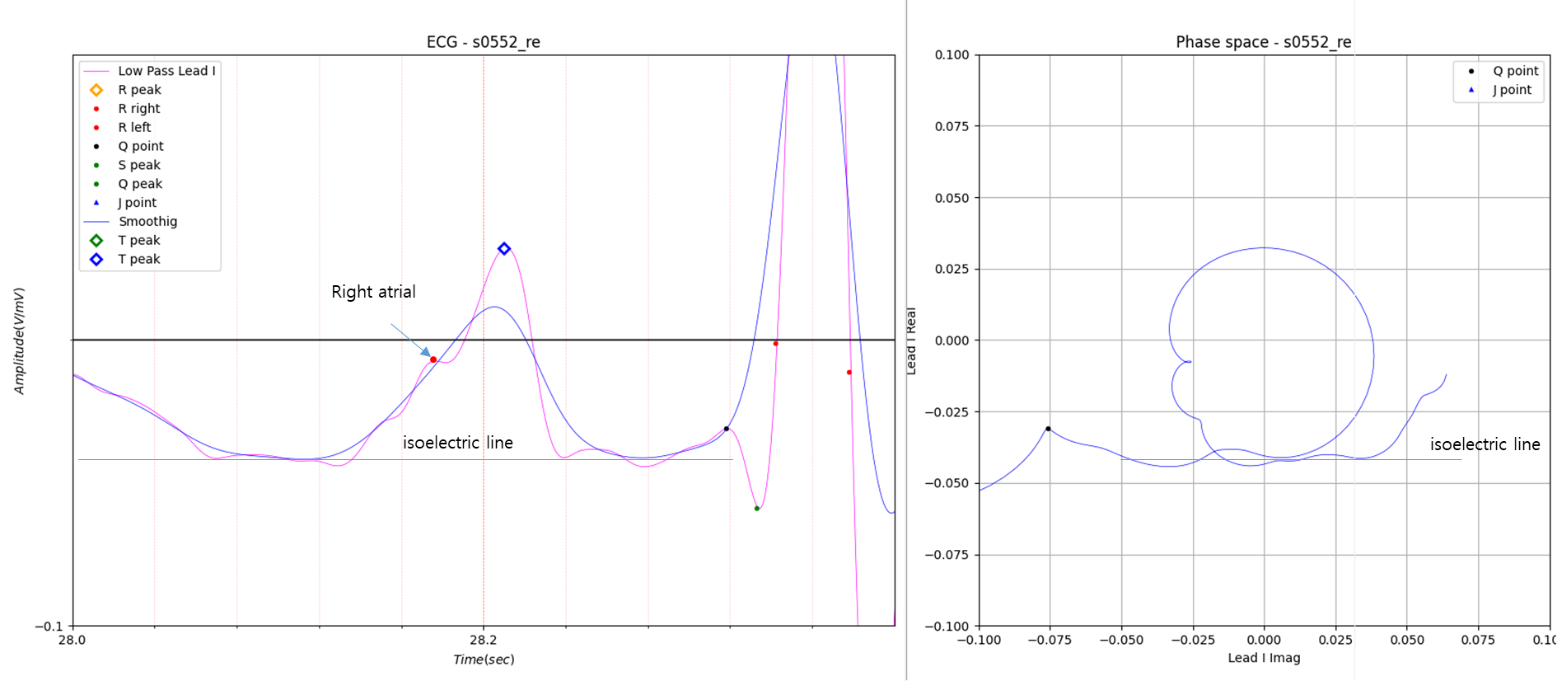
Fig.9 Unusual type P peak of Healthy control 2
In Fig.9, the left and right isoelectric lines coincide.
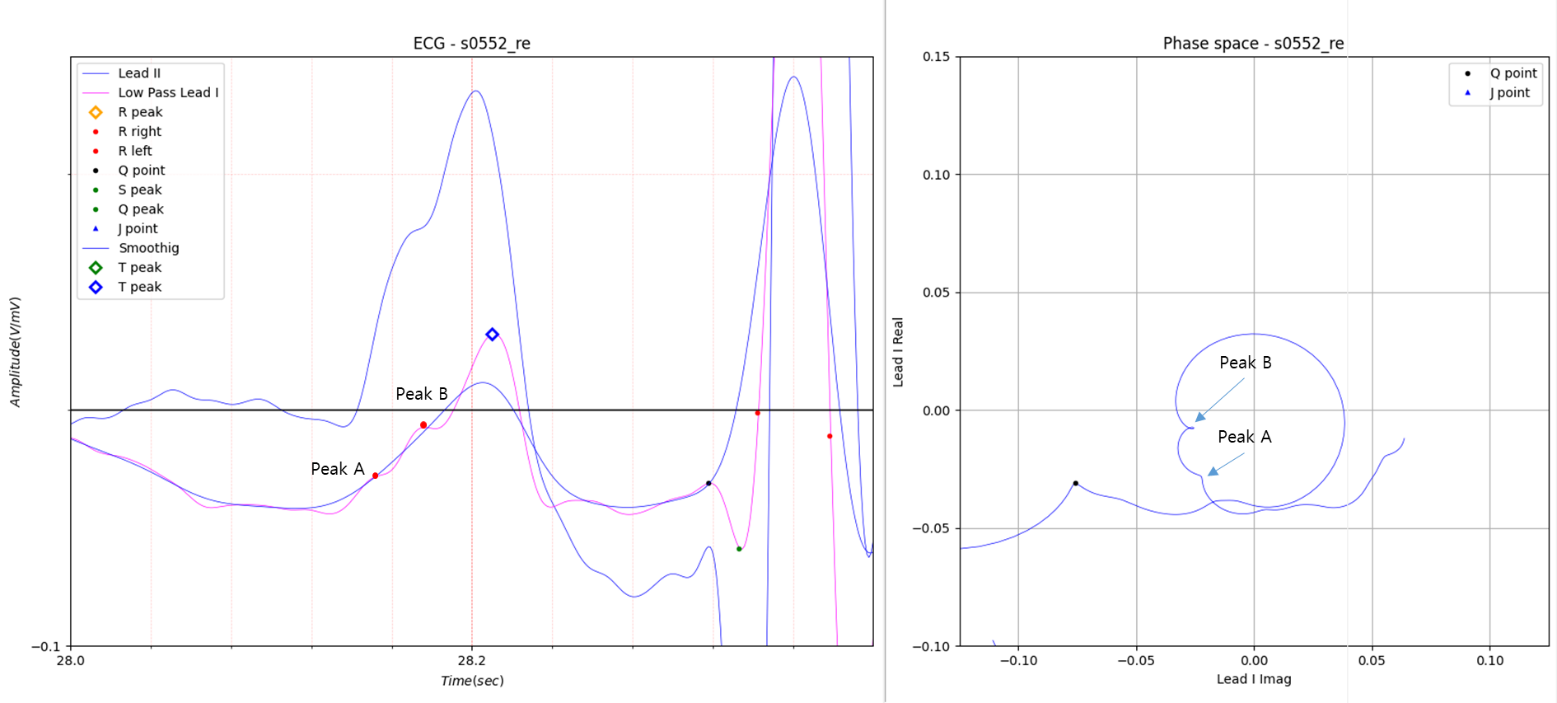
Fig.10 Unusual type P peak of Healthy control 3
In Figure 10, there are two peaks of the Imaginary part in a row. In this case, the peaks of the two consecutive
imaginary parts are thought to be because the right atrial is biphasic.
Even when I ask Korean cardiologists for advice on these cases, they only look at the regular ECG graph and take it very
seriously when I show them an enlarged graph like this. I promise that anyone who is interested in what I post and wants
to study it can use it as they wish without having to ask for my specific consent.
I learned from the following references that P wave abnormalities may be caused by myocardial infarction.
I am convinced that P wave axis deviation is a more accurate means of identifying P wave abnormalities than P wave
dispersion.
The difference between Figures 1 and 2 is that in Figure 1, there is a problem in the P wave axis deviation of all P
waves, and in Figure 2, there is a problem in 4 places.
Is the diagnosis result in Figure 2 a result of missing the problematic P wave in 4 locations, or is it a diagnosis that
the patient does not have a disease even though there is a problem in 4 locations? This is a very difficult task for me,
who is not an electrocardiogram diagnosis expert.
References
- P Wave Dispersion and Maximum P Wave Duration Are Associated with Renal Outcomes in Chronic Kidney Disease - PMC
- Change of the P wave duration and P wave dispersion according to treatment strategy in patients with a acute myocardial infarction
- Effects of P‐wave Dispersion on Atrial Fibrillation in Patients with Acute Anterior Wall Myocardial Infarction
- P-wave dispersion: What we know till now?
- ECG Standards and Formats for Interoperability between mHealth and Healthcare Information Systems: A Scoping Review - PMC (nih.gov)