Projects ECG (Electrocardiogram) Monitoring
Detect Bundle Branch Block using Phase space
In the previous article, QRS complex J point II Case 2, I introduced how to find the Bundle Branch Block using Boundary conditions.
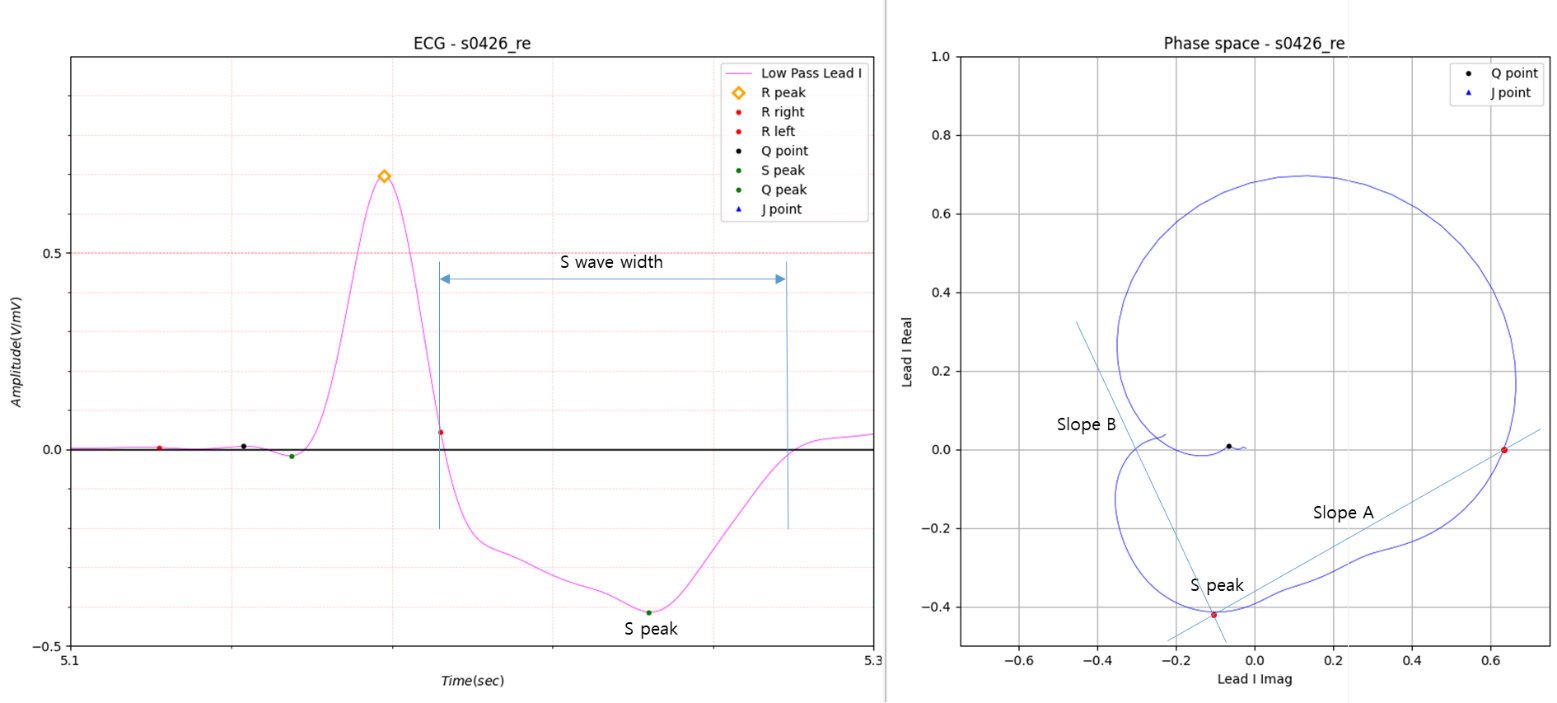
Fig.1 Various type of Bundle branch block
slope A: 0.576, slope B: -3.184, S wave width: 88
If the S wave is wide, as shown in Fig.1, it is easy to recognize a Bundle Branch Block.
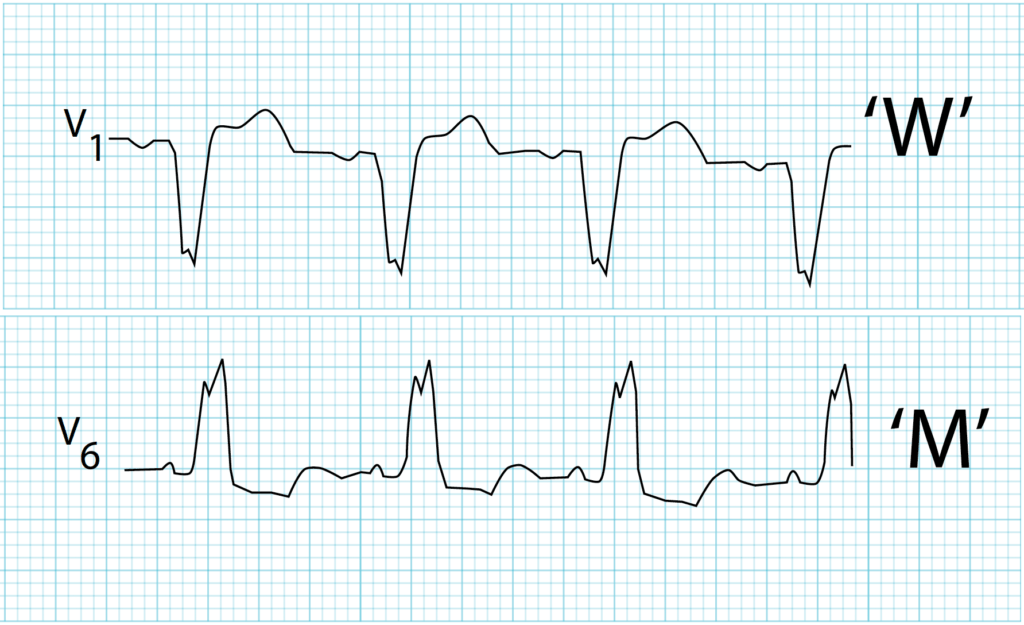
Fig.2 Left Bundle Branch Block
LBBB: Left Bundle Branch Block
V1: Dominant S wave
V6: broad, notched (‘M’-shaped) R wave
Fig.2 shows the case of a Left Bundle Branch Block.
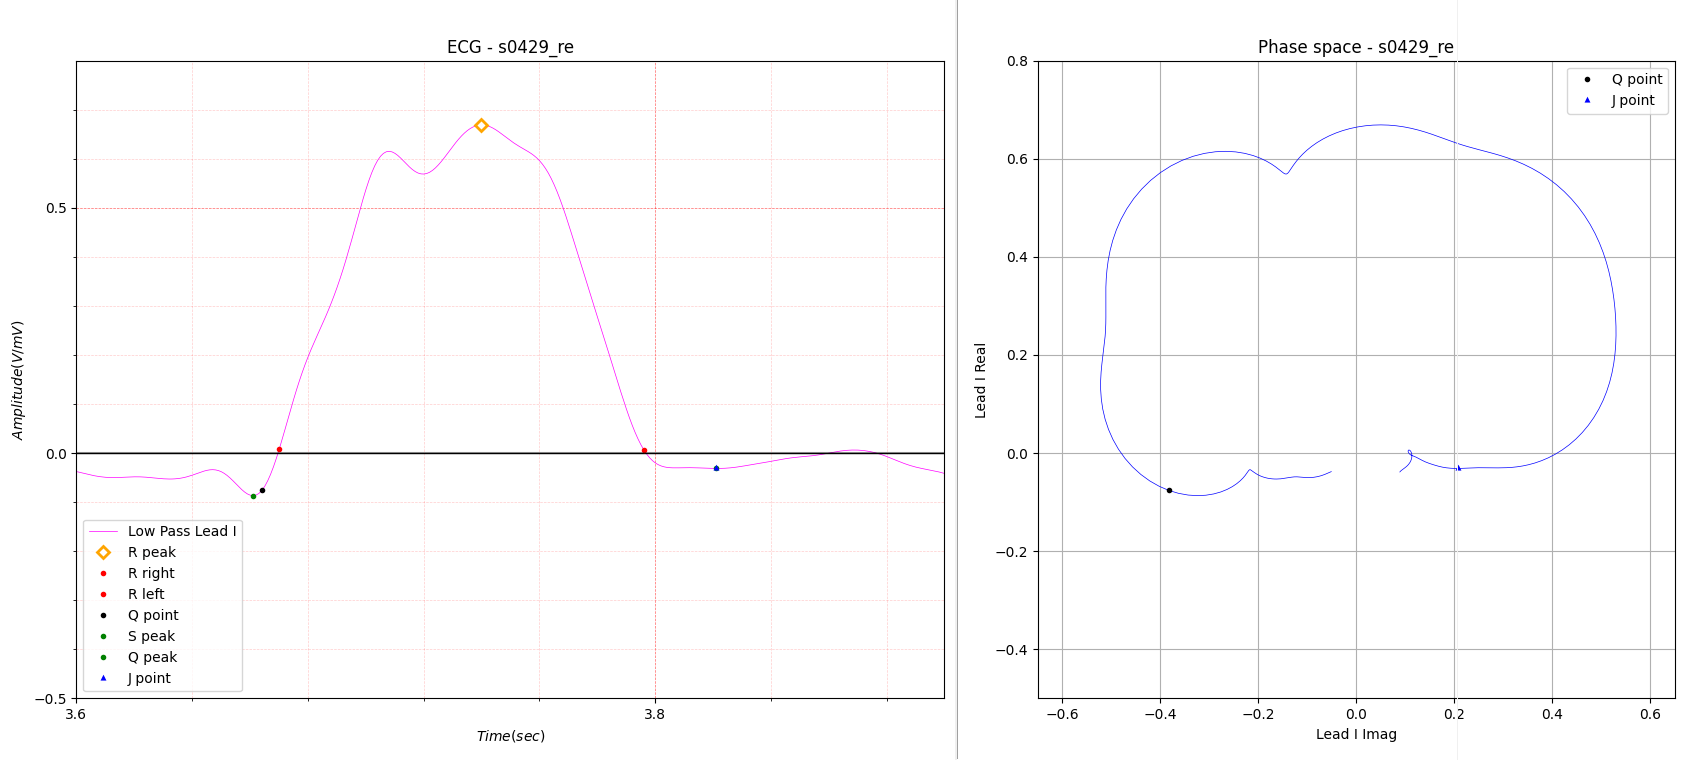
Fig.3 Left Bundle Branch Block of Lead I
Fig.3 shows the Left Bundle Branch Block for Lead I. In Lead I, the Left Bundle Branch Block has multiple R waves. In this post, I will introduce cases where it is difficult to recognize Bundle Branch Block in a single lead, except in cases where it is easy to recognize Bundle Branch Block in a single lead as shown in Fig.1 and Fig.3, and introduce how to diagnose Bundle Branch Block in these cases.
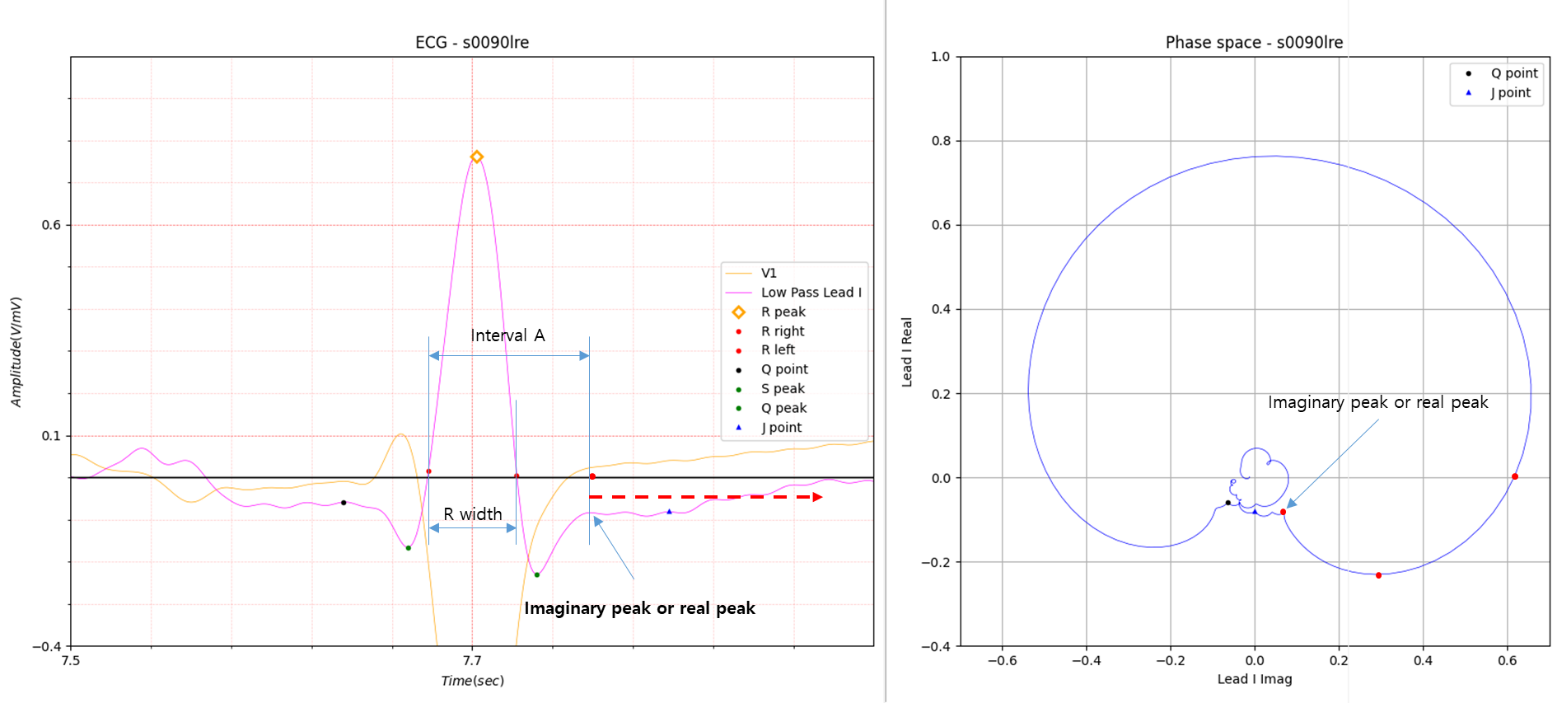
Fig.4 R width: 46.29
Fig.4 is an electrocardiogram of a myocardial infarction. Myocardial damage can cause QRS duration to exceed 120 sometimes. This is similar to the QRS complex J point II Case 2 electrocardiogram. The difference is that it passes through an imaginary or real partial peak and stays below zero for some time, as shown by the red dotted line in the figure. Let's take a moment to introduce the pathology of this case.
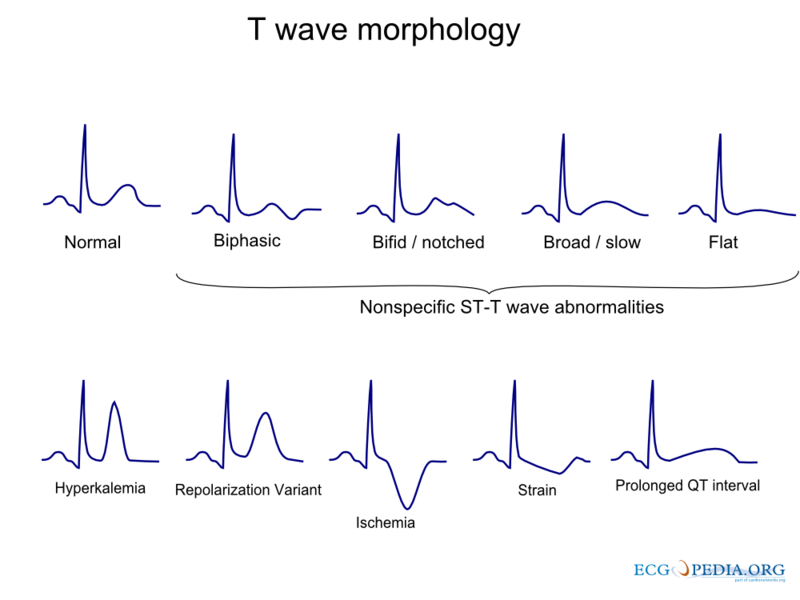
Fig.5 T wave morphology
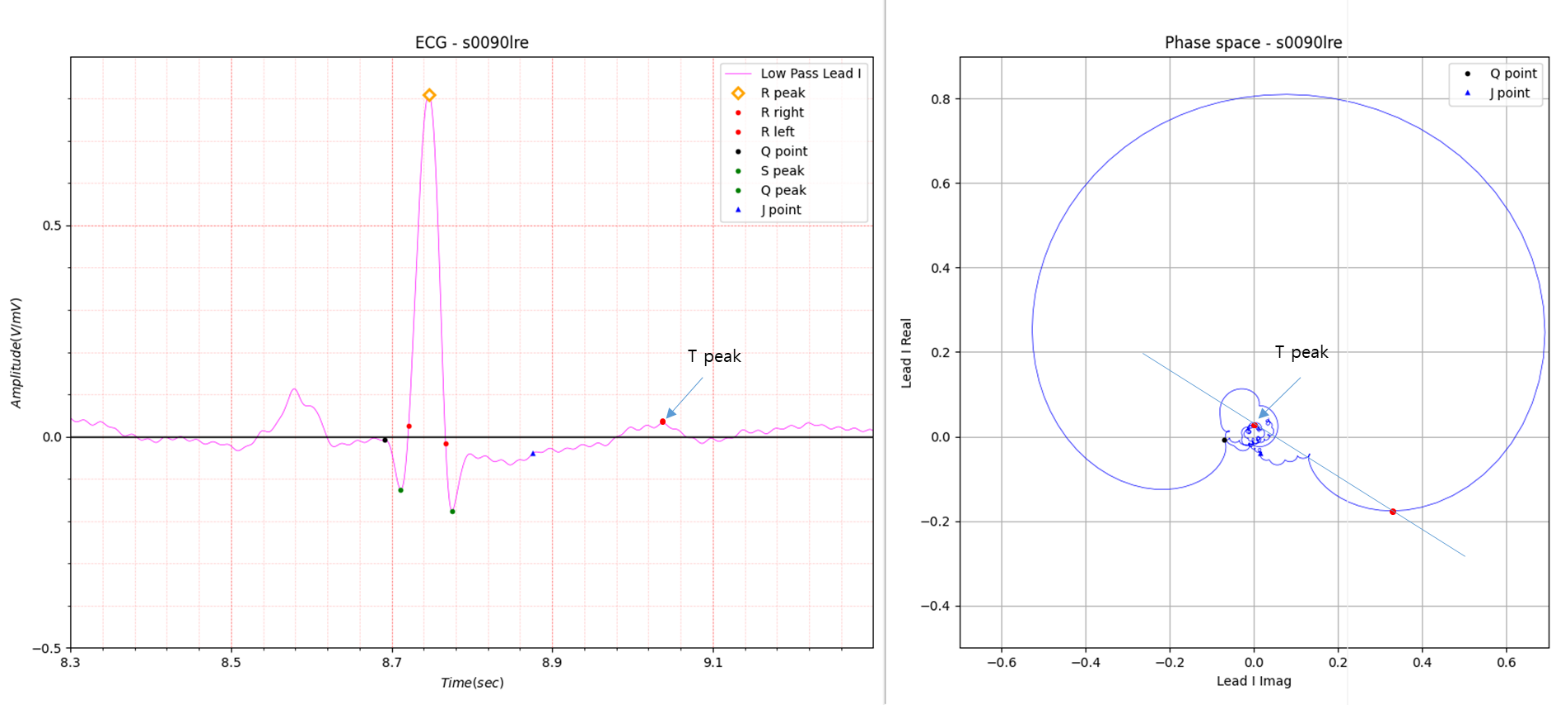
Fig.6 Flat T wave
For cases like the one in Fig.4, it was quite overwhelming to have to add exceptions to the complex boundary condition
introduced in QRS complex J point II Case 2. The complexity of the code made debugging difficult.
In order to overcome this difficult situation, it became necessary to break away from the previous microscopic
perspective and redefine the boundary condition from a macroscopic perspective.
There is nothing wrong with the method introduced in QRS complex J point II Case 2, but I wanted to find a simpler way
to replace the fairly complex boundary condition.
The clue is the slope A shown in Fig.1.
In the case of the Right Bundle Branch Block, just before reaching the S peak from the R peak, it has an S peak that has
a notch or appears to have a blunt end.
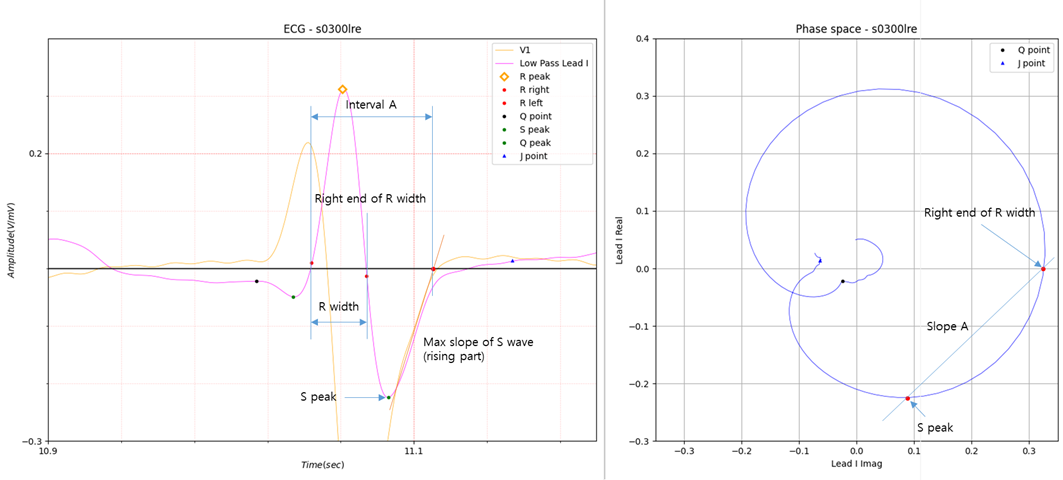
Fig.7 slope A: 0.965, slope B: -1.629, R width: 29.05
Fig.7 shows an ECG diagnosis with no abnormal findings.
Slope A has a value close to 1.
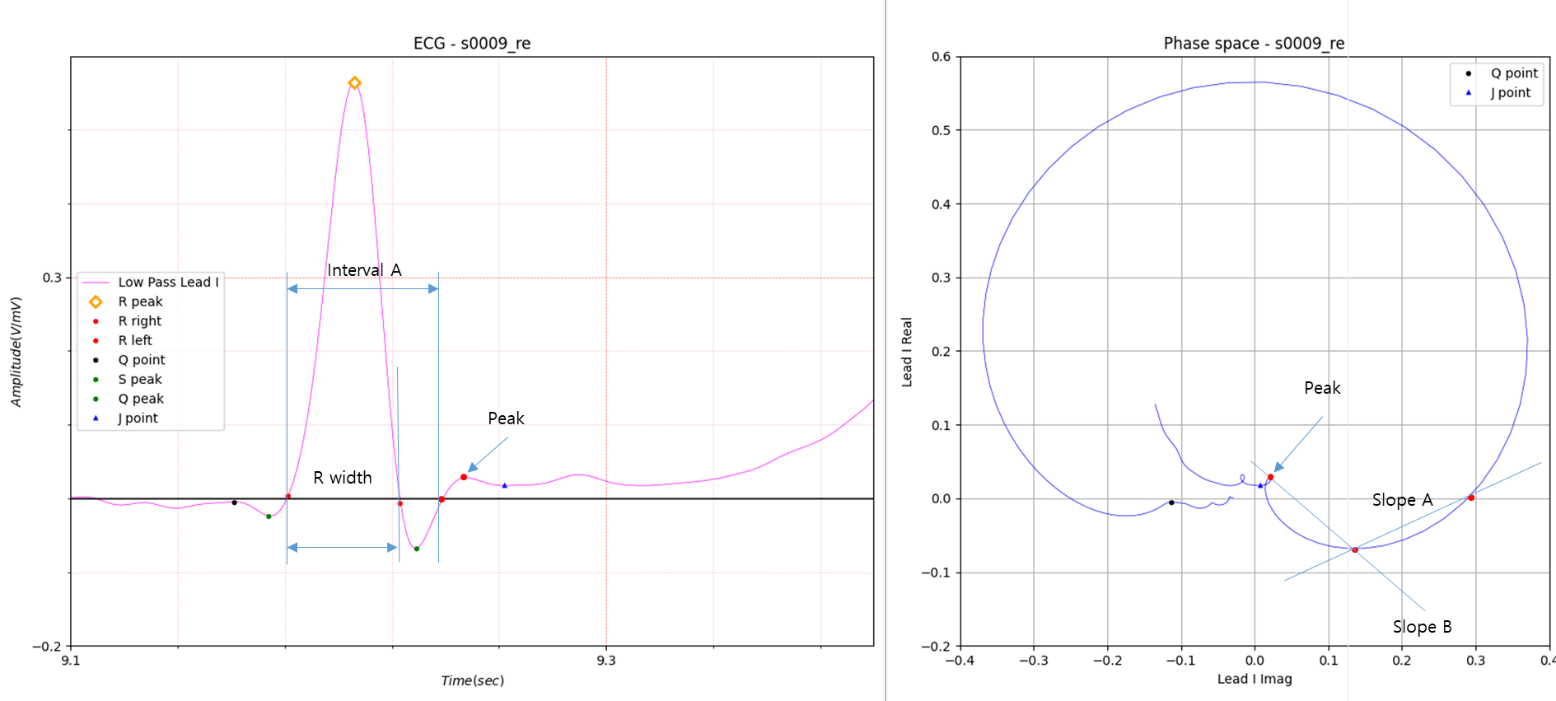
Fig.8 slope A: 0.599, slope B: -0.811, R width: 40.87
Fig.8 is the case introduced in QRS complex J point II Case 2. A brief explanation of the terminology used here is in
order. These terms are my definitions and may not be the official terminology.
R width: The width from the point closest to the 0 level in the ECG data from the Q peak to the R peak to the point
closest to the 0 level in the ECG data from the R peak to the S peak.< br>
Slope A: The slope of the line connecting S peak to the right end of R width.
slope B: The slope of the line from S peak to the point closest to 0 past S peak. If the line past S peak does not pass
through 0 before the first peak (imaginary or real part), it is defined as the slope of the line connecting the first
peak.
Interval A: the distance from the left end of R width to the point where Slope B passes
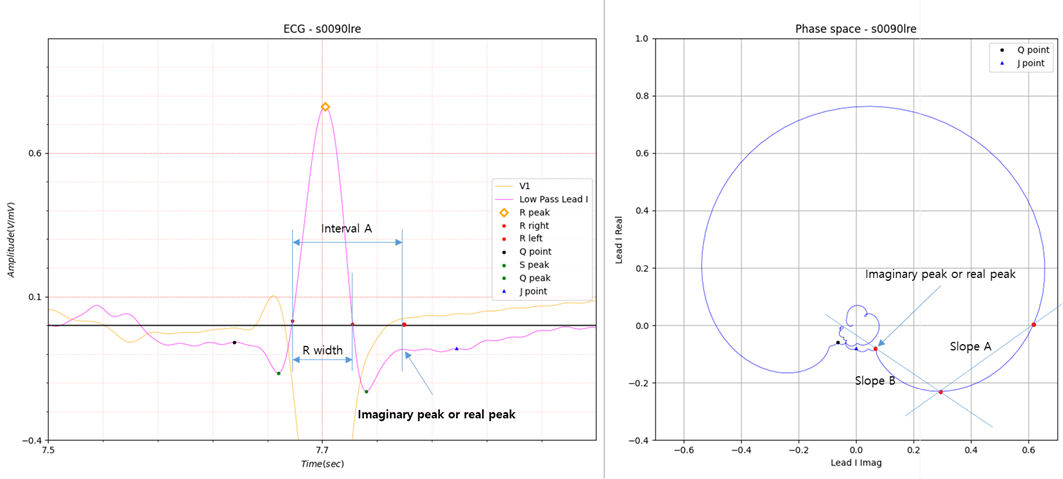
Fig.9 slop A: 0.629, slop B: -0.798, R width: 46.29
In Fig.9, it is excluded the case of not exceeding 0 by a certain interval past Interval A.
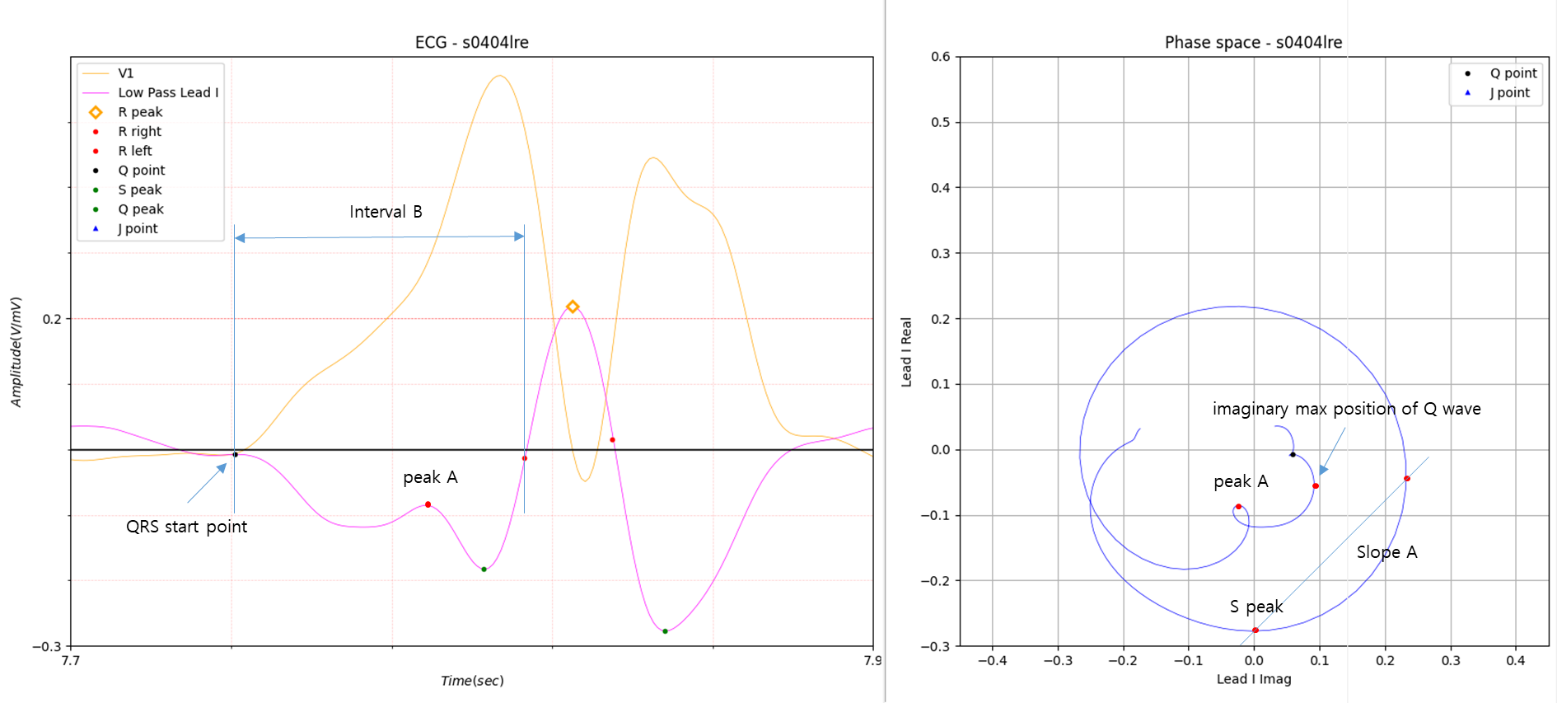
Fig.10 slope A: 1.197, slope B: -1.977, R width: 22.47
In Fig.10, interval B is extended.
interval B: The interval from the QRS start point to the left end of R width.
It is clear that the QRS start position is not Peak A when compared to the V1 lead. In Lead I single lead, the position
of the QRS start position can be determined by excluding peaks that are lower than the Imaginary max position of Q wave
in Fig.10.
In Fig.10, Slope A is above 1, so there is no singularity in the S wave part. However, interval B is prolonged in the Q
wave, indicating the presence of a bundle branch block. Below are some examples of how a bundle branch block can be
diagnosed using very simple boundary conditions.
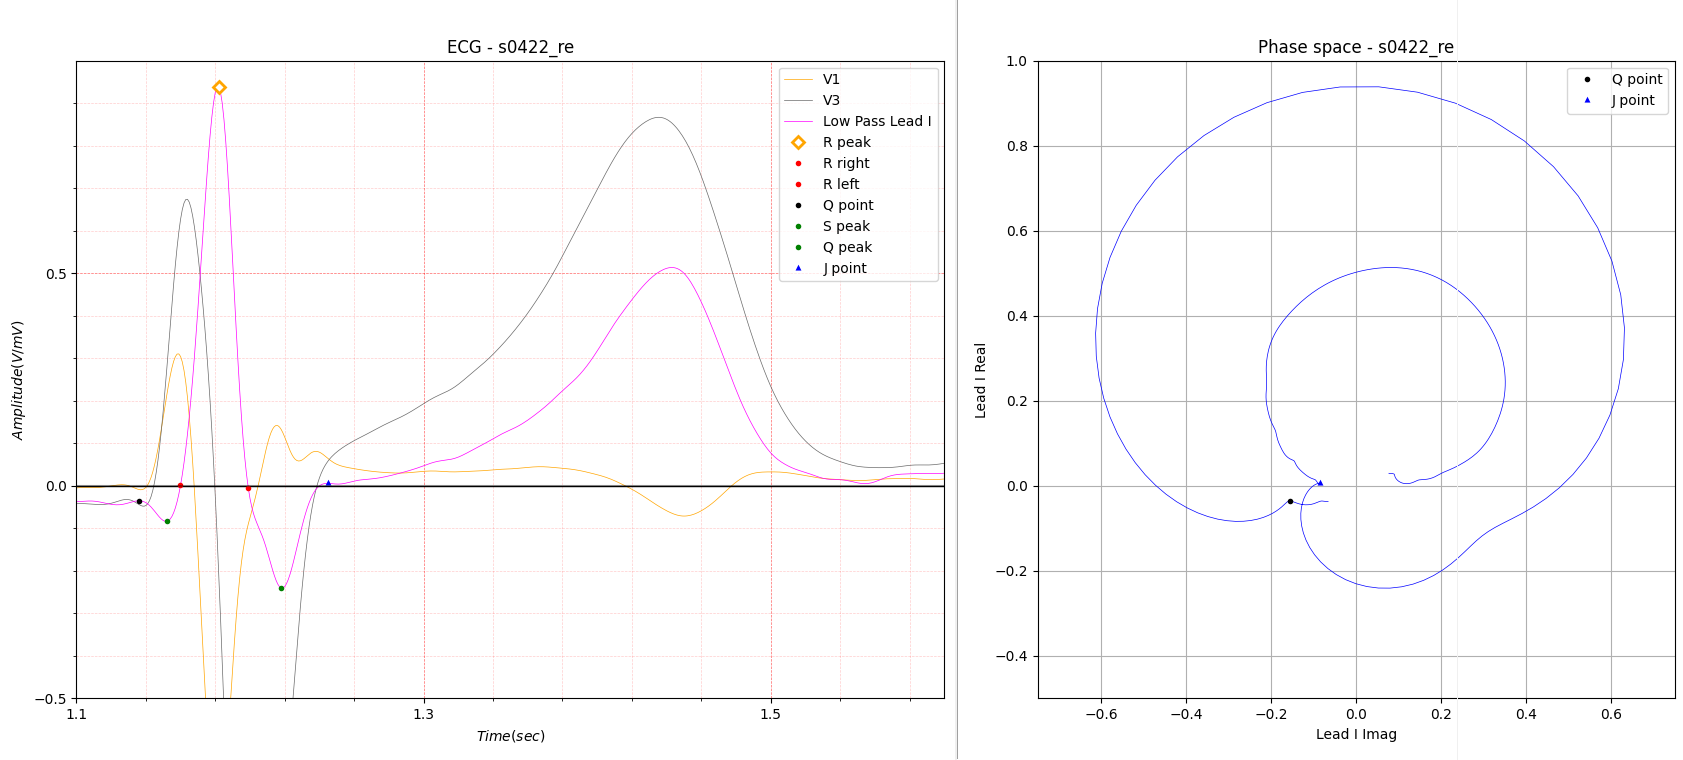
Fig.11 slope A: 0.563, slope B: -1.712, R width: 39.94
Set the slope A value (0.629) as the reference value in the case of Fig.9.
If the Slope A value is less than 0.629, the boundary condition is set as the Bundle Branch Block.
The slope value is calculated by finding the slope A value by the number of R peaks and averaging them.
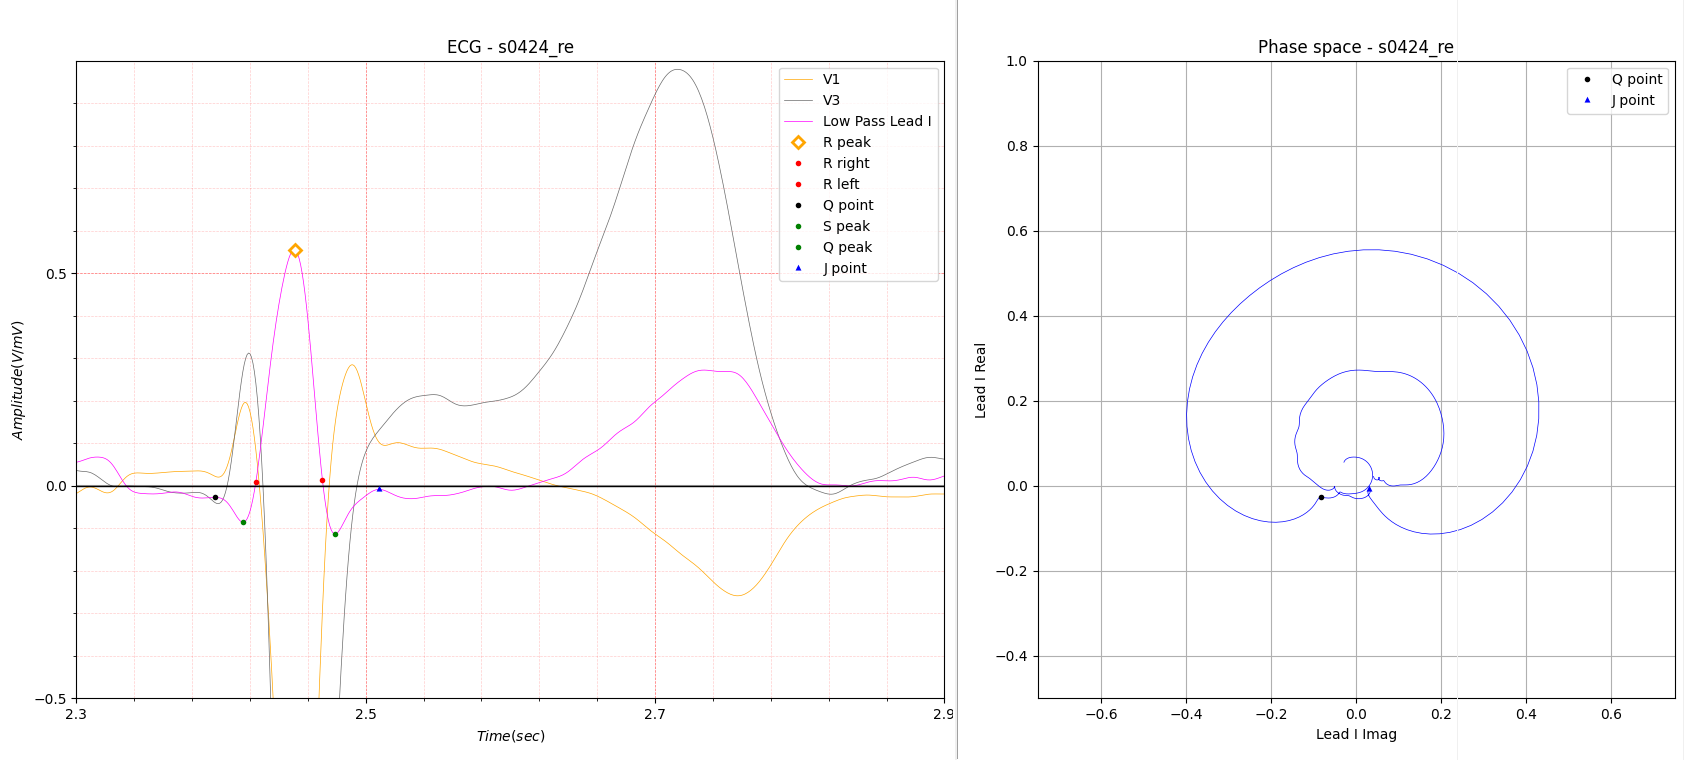
Fig.12 slope A: 0.589, slope B: -0.681, R width: 46.89
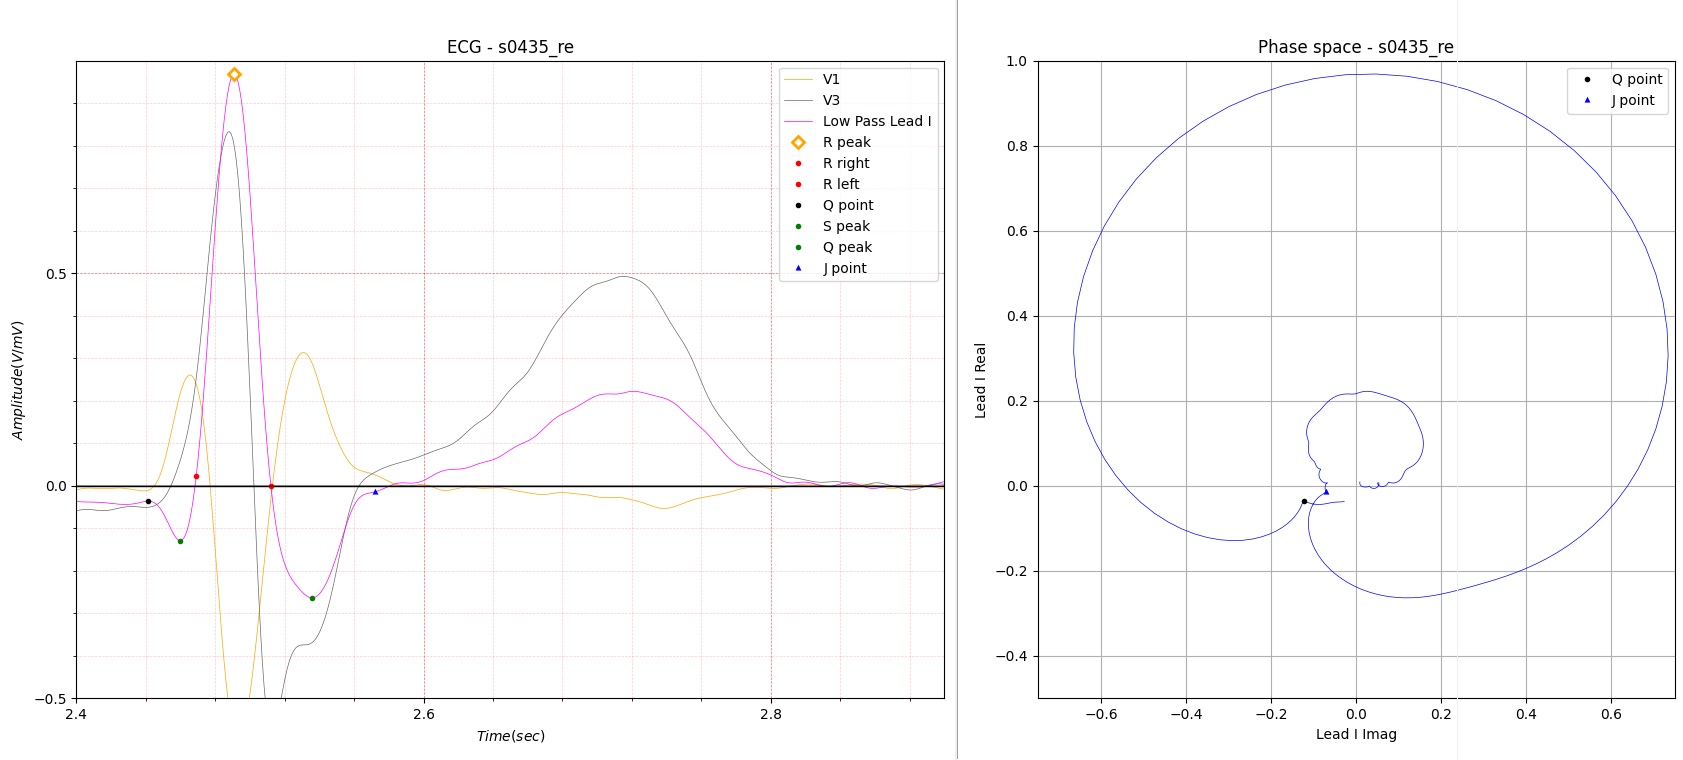
Fig.13 slope A: 0.551, slope B: -1.383, R width: 43.04
I don't plot the location of Slope A separately in Fig.11 through Fig.13 because the previous figures provide enough information.
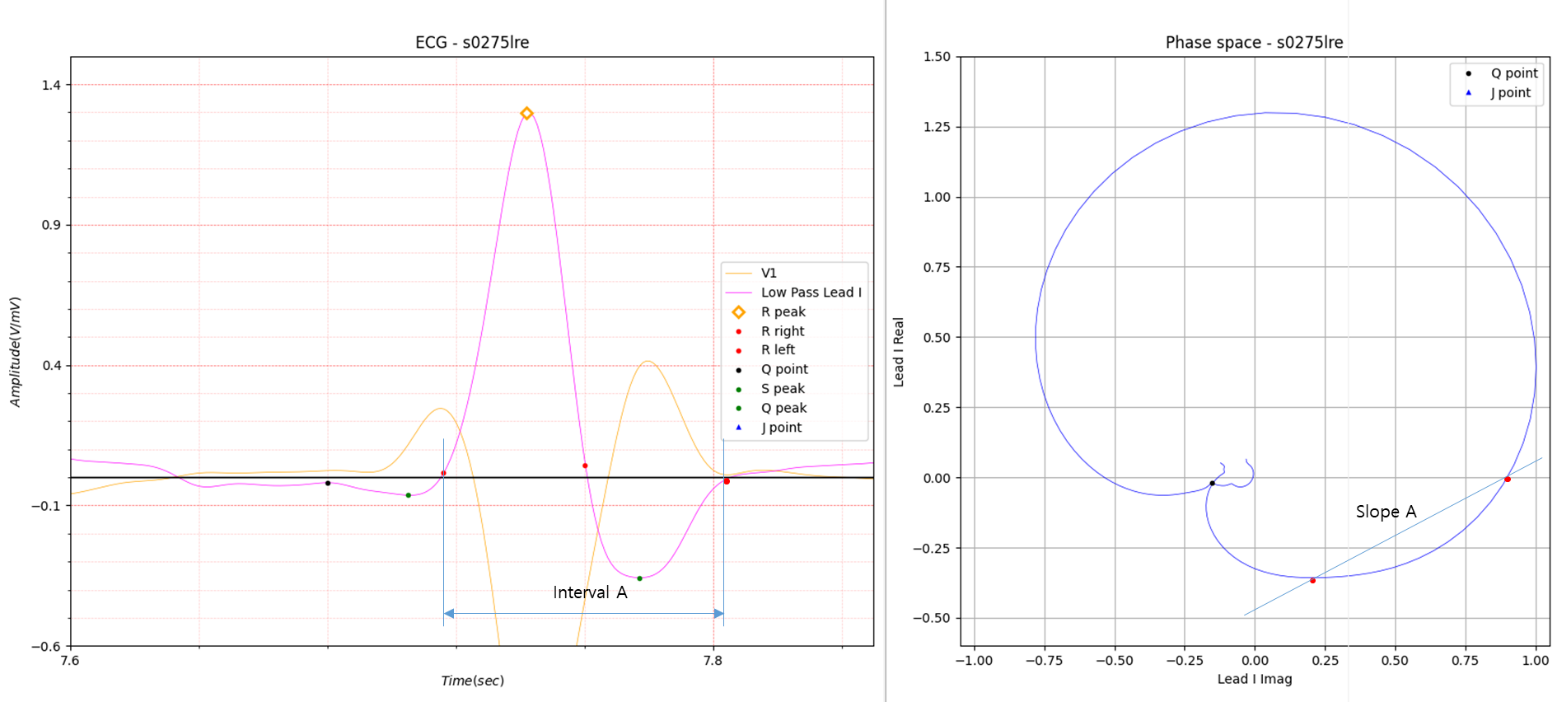
Fig.14 slope A: 0.516, slope B: -1.168, R width: 45.03
In the case of Fig.14, it is classified as having no abnormalities in ECG classification in the PTB Diagnostic ECG Database. Slope A has a smaller slope value than any of the cases introduced above 0.516. In addition, the QRS duration is greater than 120 and a Bundle Branch Block is evident even with reference to lead V1.
Appendix
Data s0009_re
39 [130 128 129 131 128 125 128 128 135 129 131 132 132 135 139 134 133 128 123 134 126 132 127 131 129 130 131 134 133
131 137 139 130 131 125 131 139 133 128]
Max: 139, Min: 123, Avg: 131.0, std: 3.749
Data s0275lre
31 [135 131 128 135 132 141 140 135 134 131 139 133 127 136 133 133 125 140 136 135 129 138 130 135 127 131 139 132 130
130 129]
Max: 141, Min: 125, Avg: 133.19, std: 4.138
s0404lre
36 [154 143 149 154 142 163 157 162 141 139 146 143 153 153 143 145 141 155 147 145 154 149 144 145 153 151 151 149 143
146 143 144 145 151 148 144]
Max: 163, Min: 139, Avg: 148.19, std: 5.763
s0422_re
32 [129 132 129 140 130 134 140 136 133 131 141 136 132 133 137 140 137 134 130 133 135 138 135 130 130 122 134 131 134
135 135 142]
Max: 142, Min: 122, Avg: 134.0, std: 4.161
Data s0424_re
28 [135 129 131 135 138 129 132 141 134 131 132 134 138 139 135 125 128 133 138 127 131 131 128 129 123 130 132 130]
Max: 141, Min: 123, Avg: 132.07, std: 4.225
Data s0435_re
45 [132 130 130 131 132 128 128 137 132 128 131 130 126 117 127 126 128 128 130 131 136 131 133 134 133 129 136 135 135
127 128 130 131 129 130 129 133 132 134 134 121 126 133 128 133]
Max: 137, Min: 117, Avg: 130.27, std: 3.738