Projects ECG (Electrocardiogram) Monitoring
QT interval II
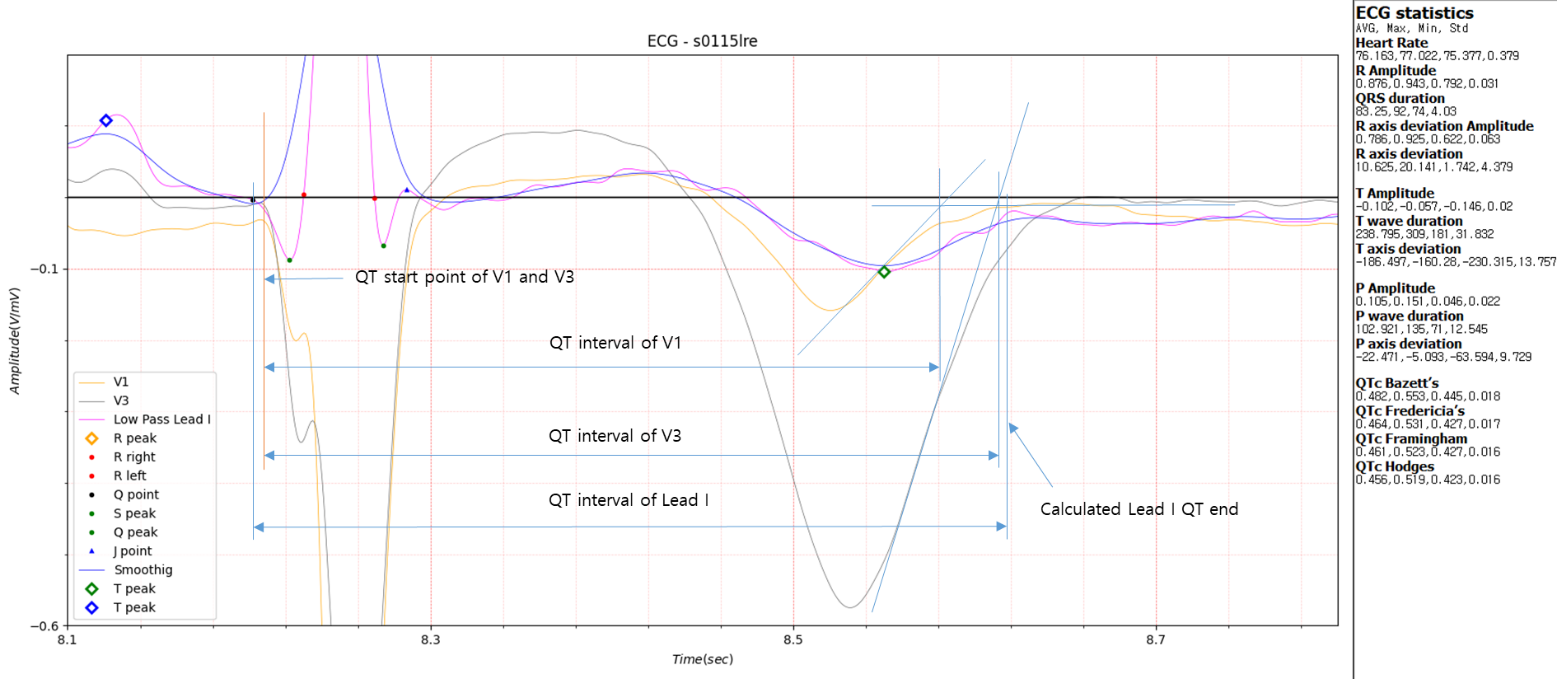
Fig.1 QT Interval
In the previous post, QT interval, it was seen that in the case of Lead V1 in Fig. 1, there was a large difference in QT interval compared to other leads. In this post, I look at cases like this in more detail and how to determine the QT interval end point.
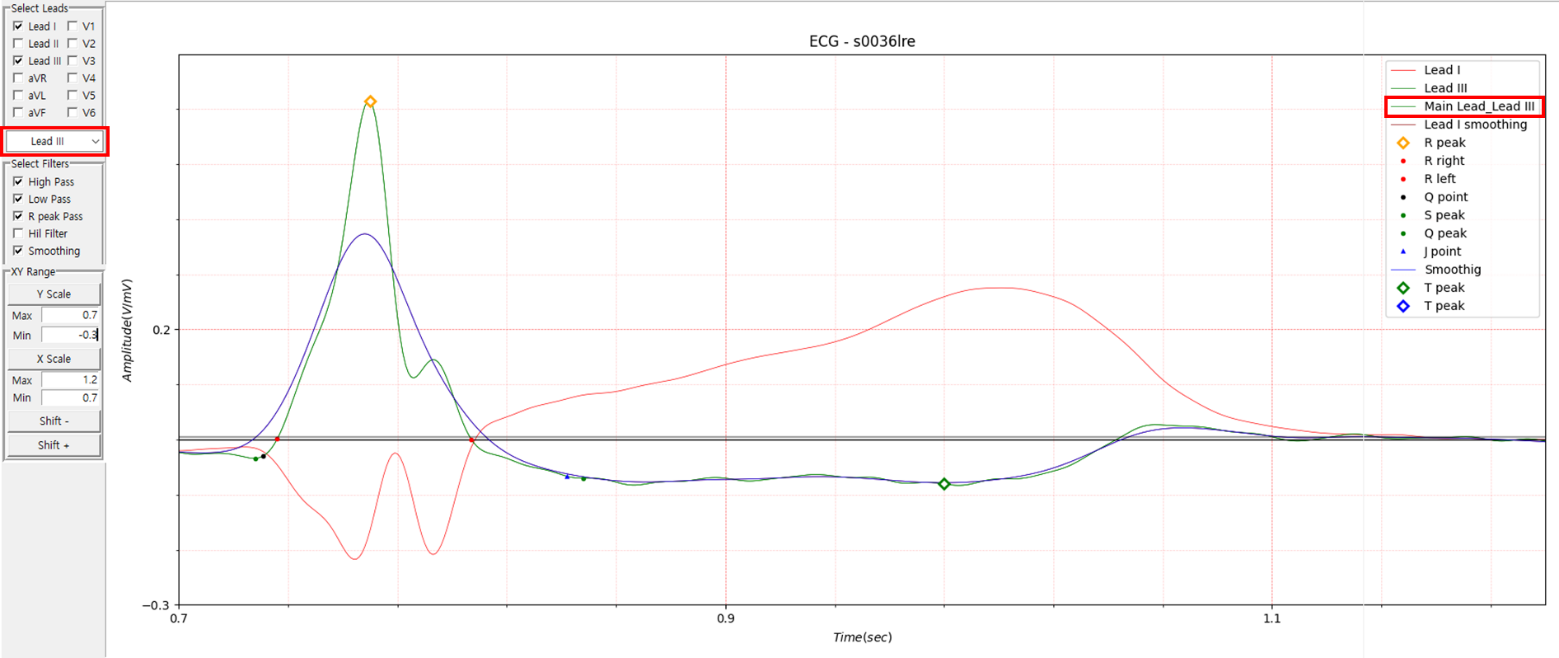
Fig.2 New GUI for multi lead
So far, the analysis has focused on a single lead, Lead I, so it was not possible to measure the QT interval of leads
other than Lead I using the method introduced in the previous post, QT interval. To solve this, the GUI was changed as
shown in Fig.2.
In this post, I look at the QT interval end point, focusing on the s0036lre case, which shows complex aspects before and
after the first positive T wave peak after the negative T wave peak.
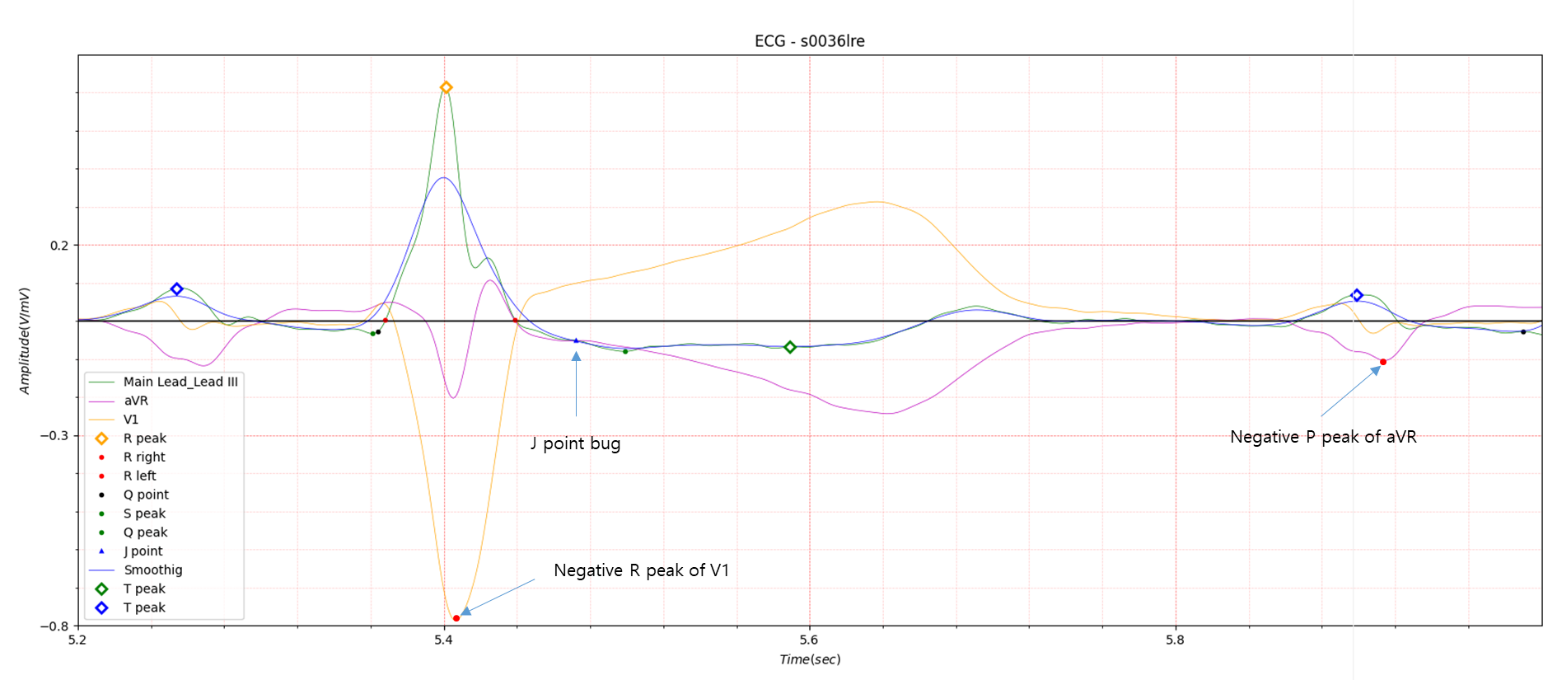
Fig.3 not considered in single lead
When converting the software structure to multi-lead to analyze S0036lre data, there were several issues that were not
considered in single-lead, as shown in Fig.3. It seems that it will take some time to operate the software normally
without errors.
In this post, I first compare the results by applying the method introduced in the QT interval to Leads I, II, and III. In
S0036lre data, Positive T wave peaks are classified into about 6 types, which are introduced in each figure below.
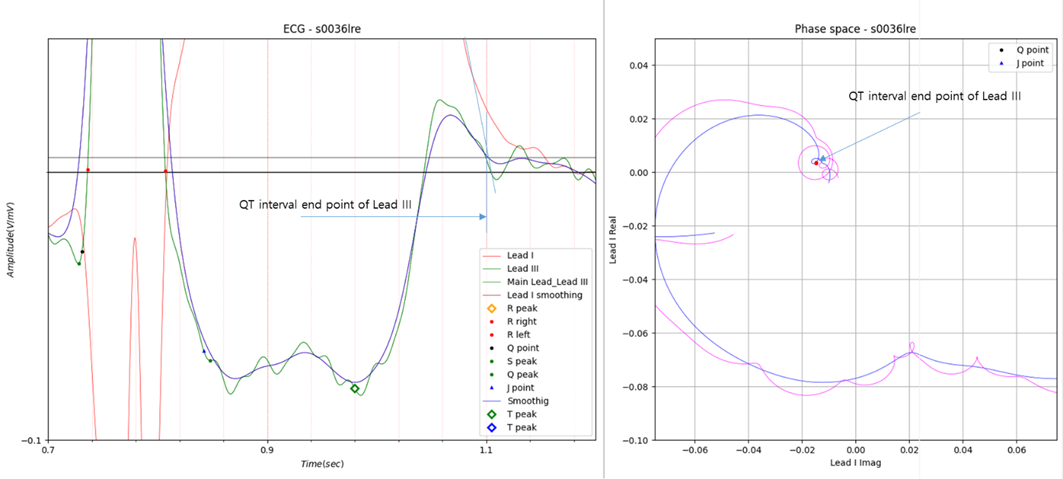
Fig.4 Case 1
The results of calculating the QT interval of each lead based on the newly applied GUI are as follows.
QT interval of Lead I: 0.375
QT interval of Lead II: 0.364
QT interval of Lead III: 0.377
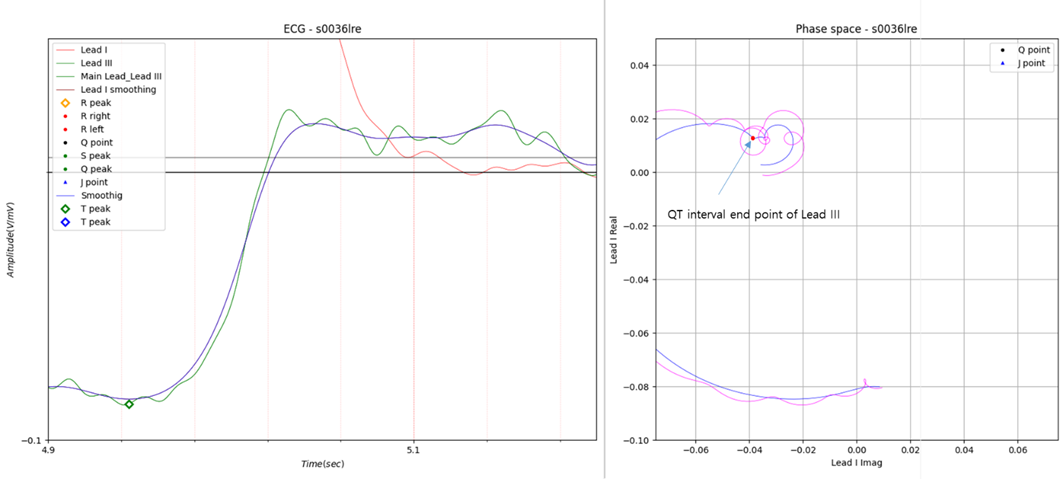
Fig.5 Case 2
QT interval of Lead I: 0.368
QT interval of Lead II: 0.361
QT interval of Lead III: 0.376
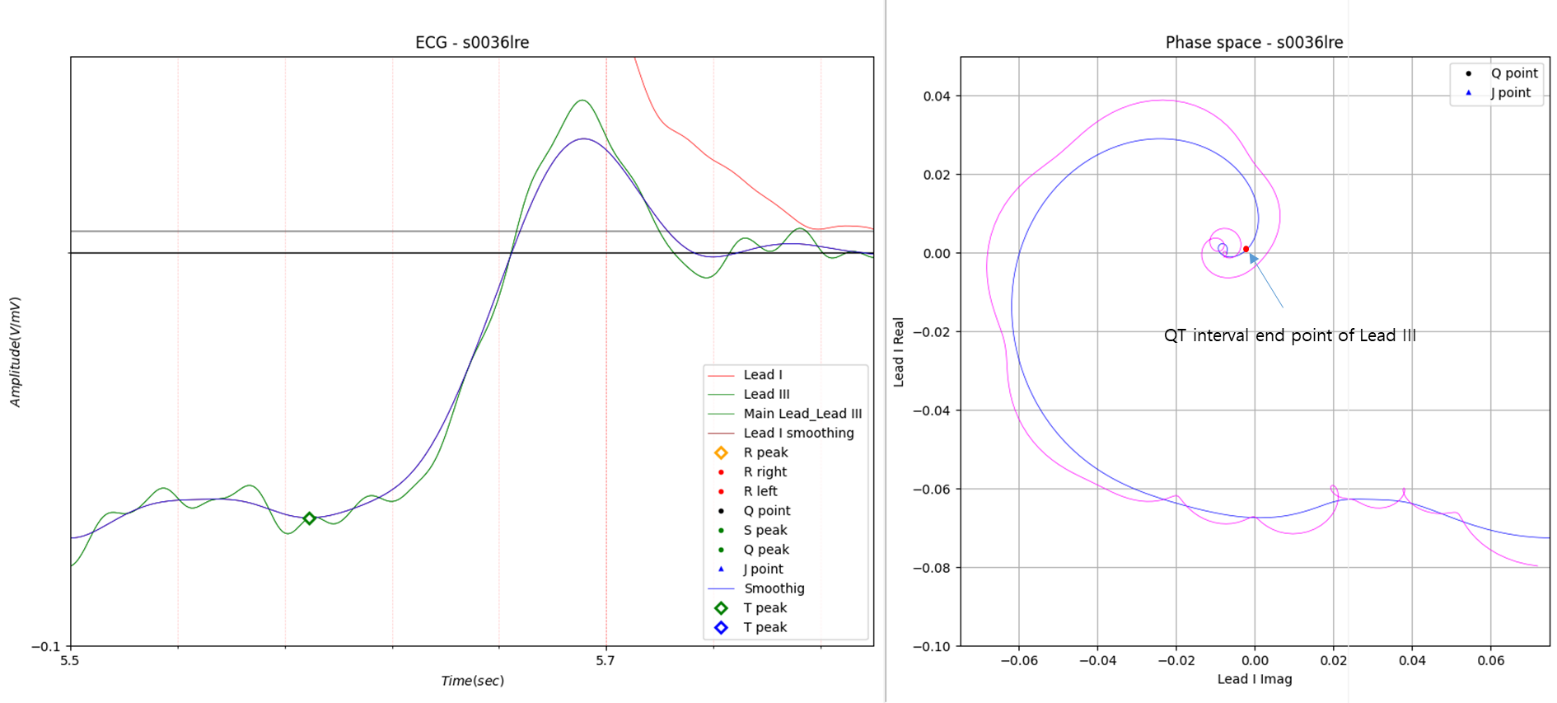
Fig.6 Case 3
QT interval of Lead I: 0.361
QT interval of Lead II: 0.358
QT interval of Lead III: 0.367
Up to this point, there is nothing special about using the inflection point in phase space.
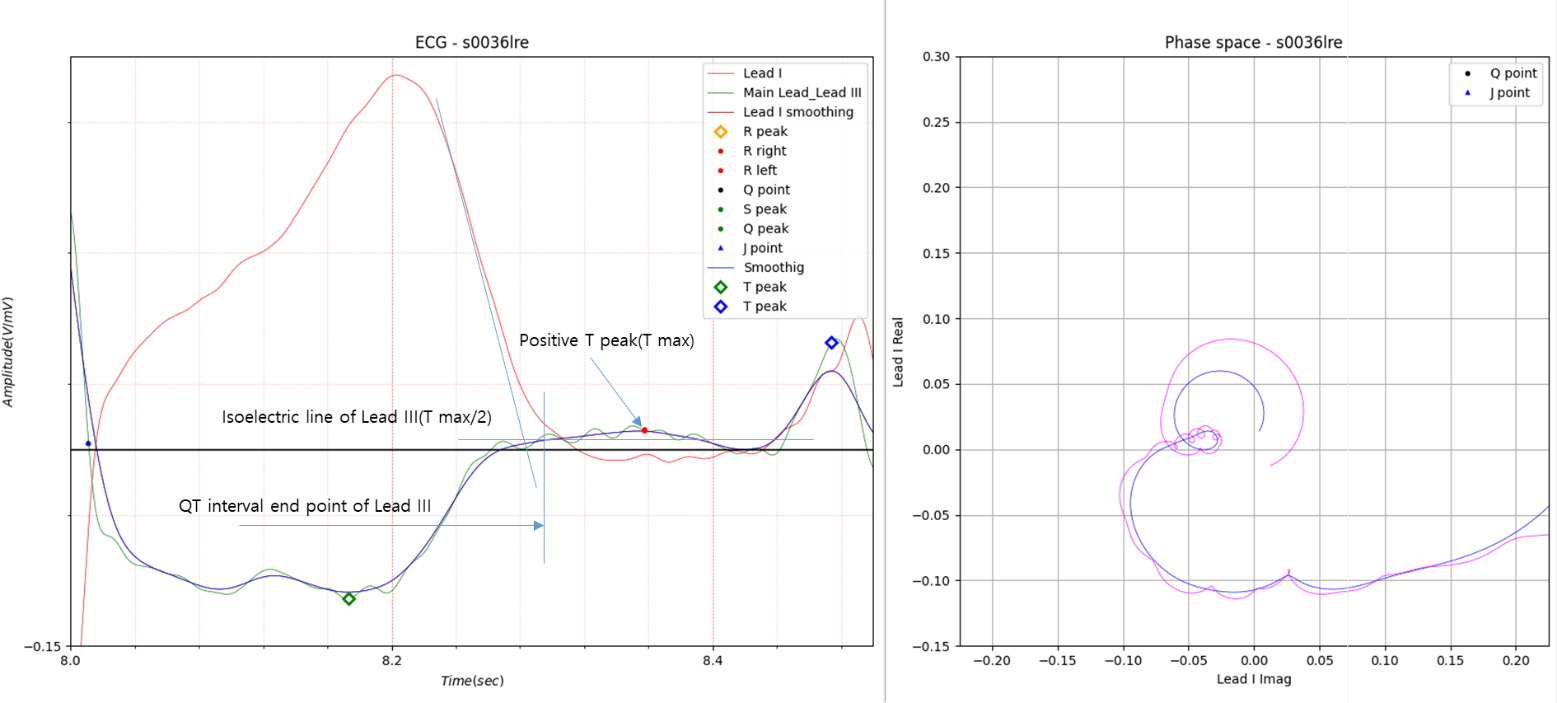
Fig.7 Case 4
QT interval of Lead I: 0.362
QT interval of Lead II: 0.355
QT interval of Lead III: 0.358
The positive T wave peak in Fig. 7 appears to be not a peak but a distorted isoelectric line. The isoelectric line value
was set to 1/2 of the peak value.
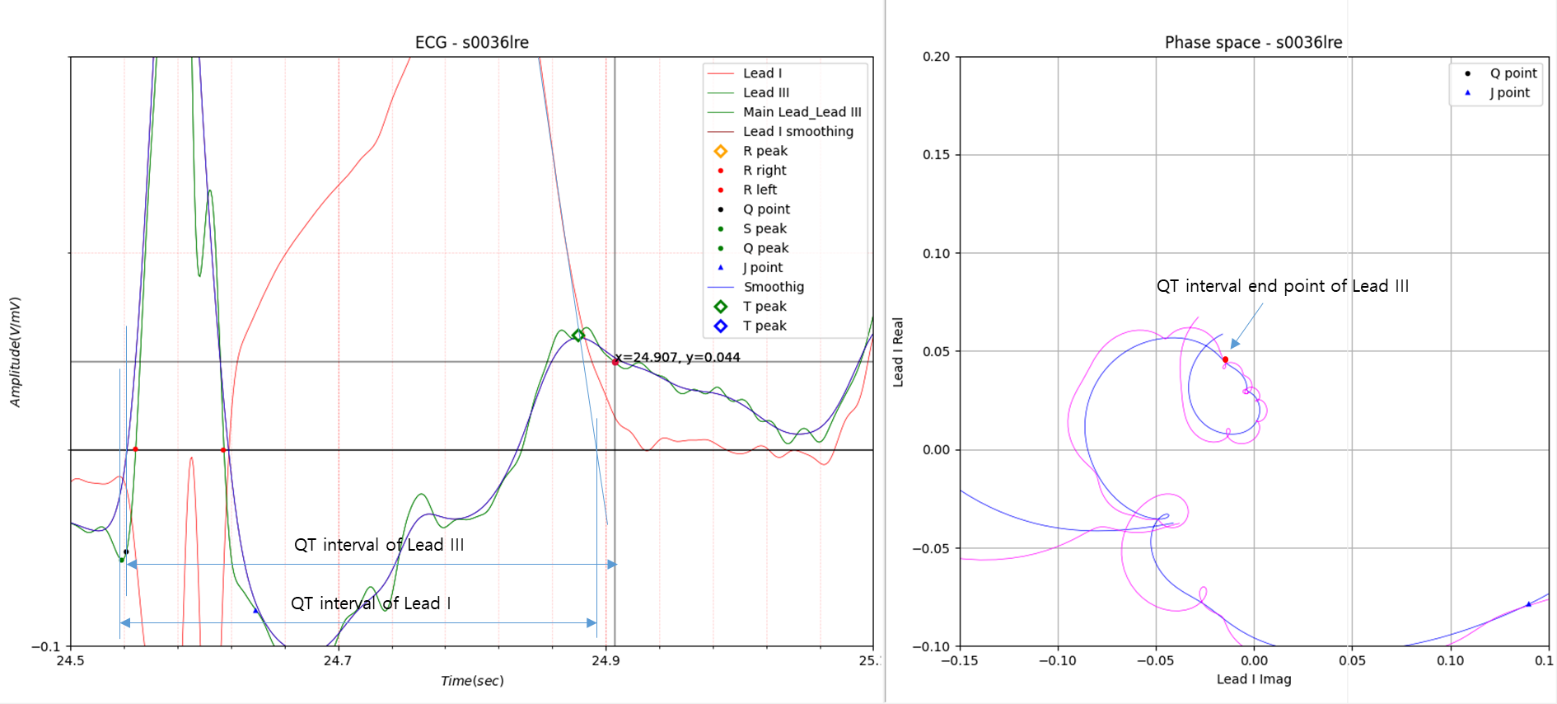
Fig.8 Case 5
QT interval of Lead I: 0.360
QT interval of Lead II: 0.367
QT interval of Lead III: 0.363
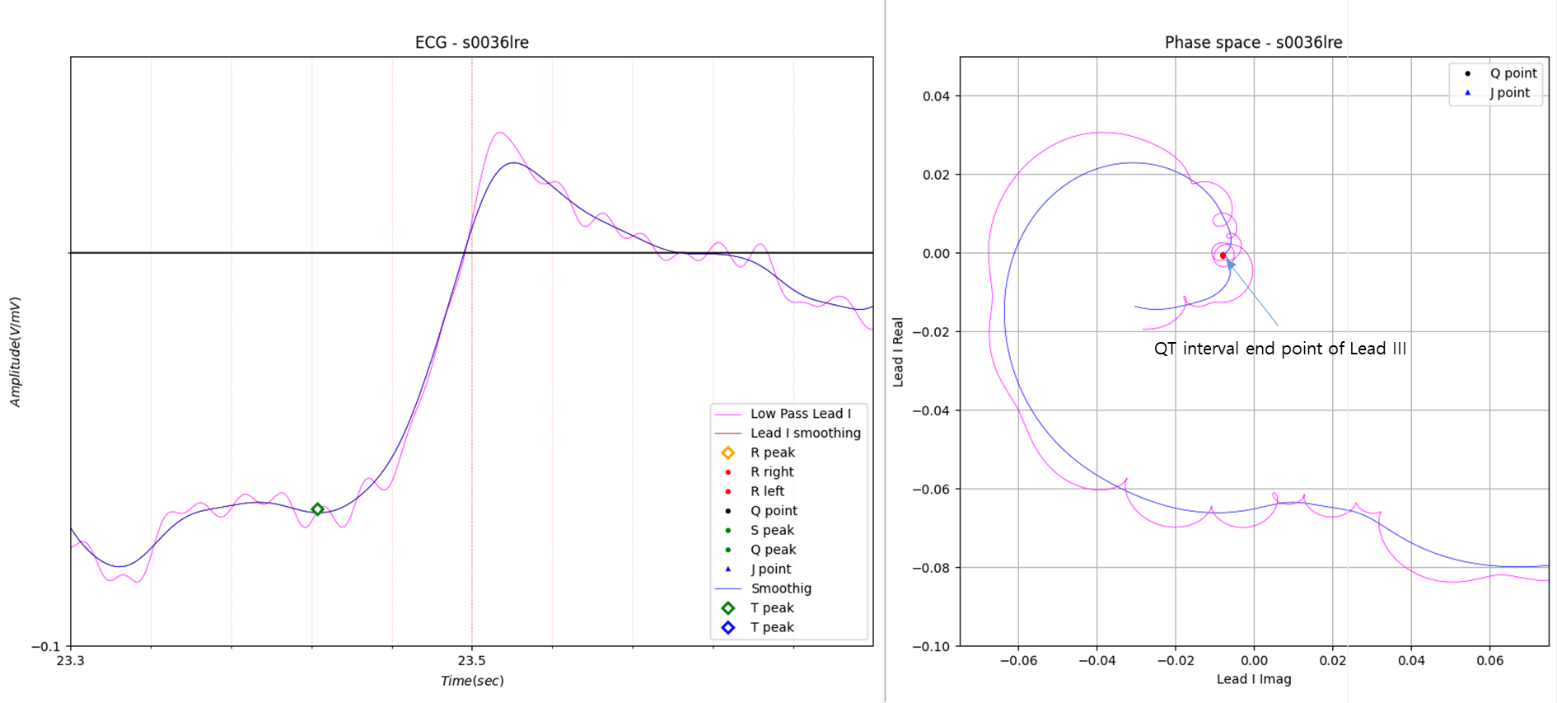
Fig.9 Case 6
QT interval of Lead I: 0.372
QT interval of Lead II: 0.372
QT interval of Lead III: 0.351
In Fig.9, the QT interval end point is excessively stretched. In phase space, the slope from the T wave peak point to
the point indicated as the QT interval end point was limited to an absolute value of 1.

Table 1 QT interval
3 Lead Avg = (361.1 + 364.2 + 361.3)/3 = 362.3
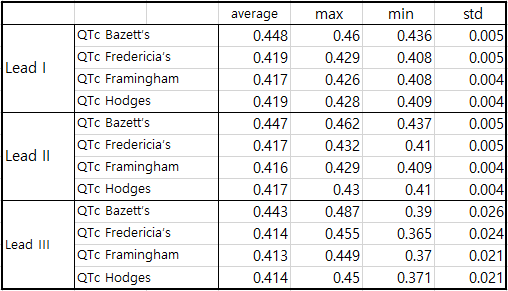
Table 2 QTc
In this post, I compared the results from multi-lead to obtain a more accurate QT interval from single-lead.
Although the data used here showed a fairly complex T wave shape in Lead III, the large deviation appears to require
improvement.
I will correct some problems and calculate the average QT interval of all 12 leads and adjust the single lead value to
most closely match the average.