Projects ECG (Electrocardiogram) Monitoring
QRS complex J point I
J point was briefly introduced in the summary section, and the basic principles were explained in an additional section. Because j points are complex, with many things to consider, this cection will only discuss the part with slurs.
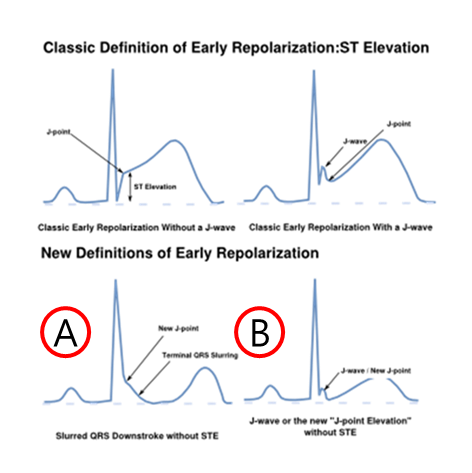
Fig.1 Early Repolarization - ECGpedia
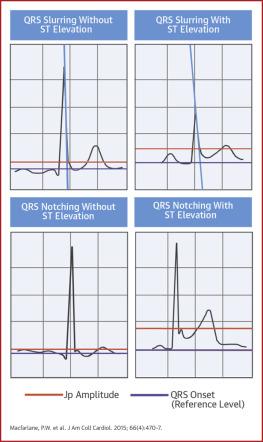
Fig. 2 The Early Repolarization Pattern: A Consensus Paper - ScienceDirect
Regarding the New J point shown in Fig. 1, it is not easy for me to judge whether this is the established theory or the claim of some scholars. If the New J point is correct, finding the J point is very easy. However, if the classic J point is a correct claim, quite a lot of conditions must be attached and very complex code must be written.

Fig.3 A case of Fig.1
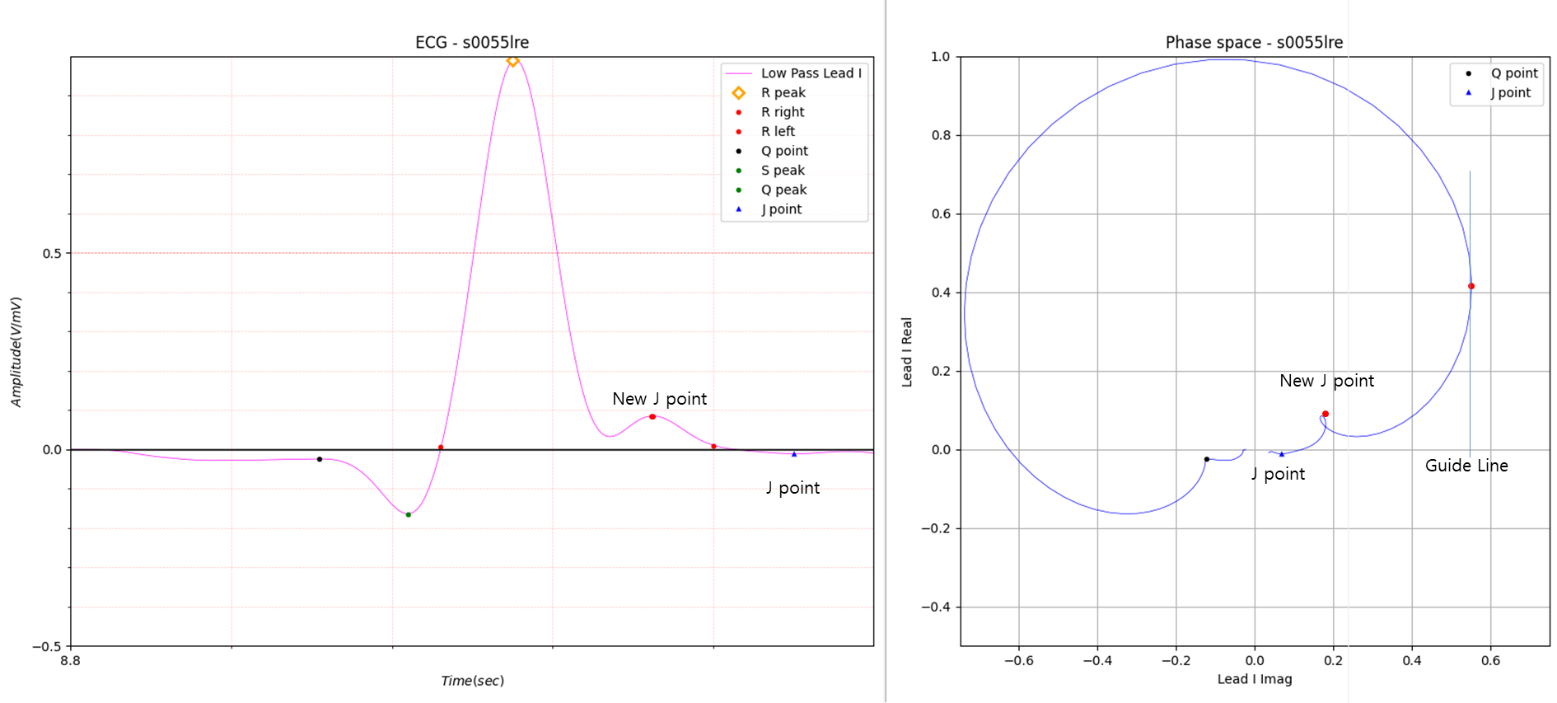
Fig.4 B case of Fig.1
Fig. 3 shows a case of Fig.1 and Fig. 4 shows the B case of Fig.1.
In both Fig. 3 and 4, the peak on the right side of the R wave in the phase space shown in Figure 4 is used as the
starting point for the J point search.
This is because multiple peaks often appear in the R wave.
Of course, there may be peaks or imaginary part peaks near the Guide Line. In this case, it is necessary to change the
Guide Line to one with a slope of 1.
The suitability of the New J point in Figures 3 and 4 will be closely examined in the following cases.
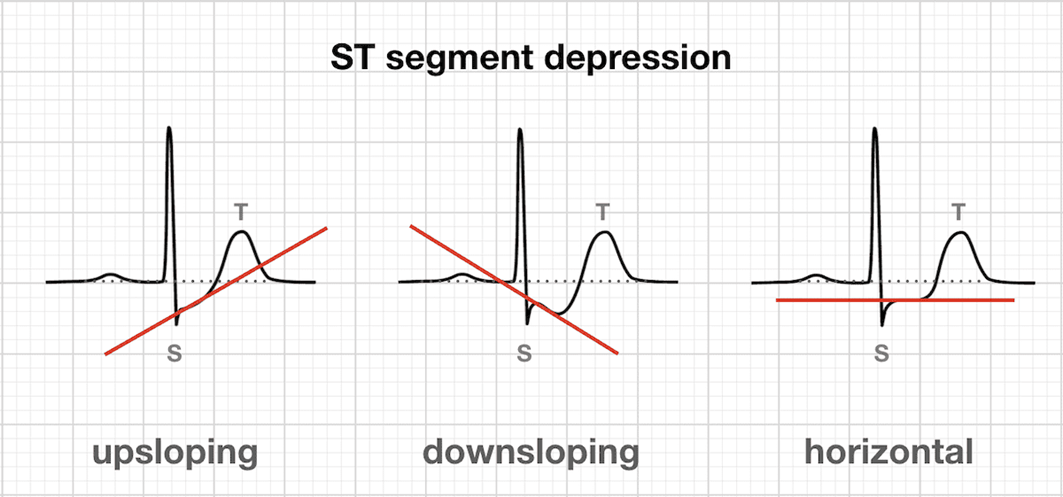
Fig.5 The ST Segment • LITFL • ECG Library Basics
Fig. 5 is used to introduce and explain boundary conditions in the following several cases.
Case 1. When noise is involved
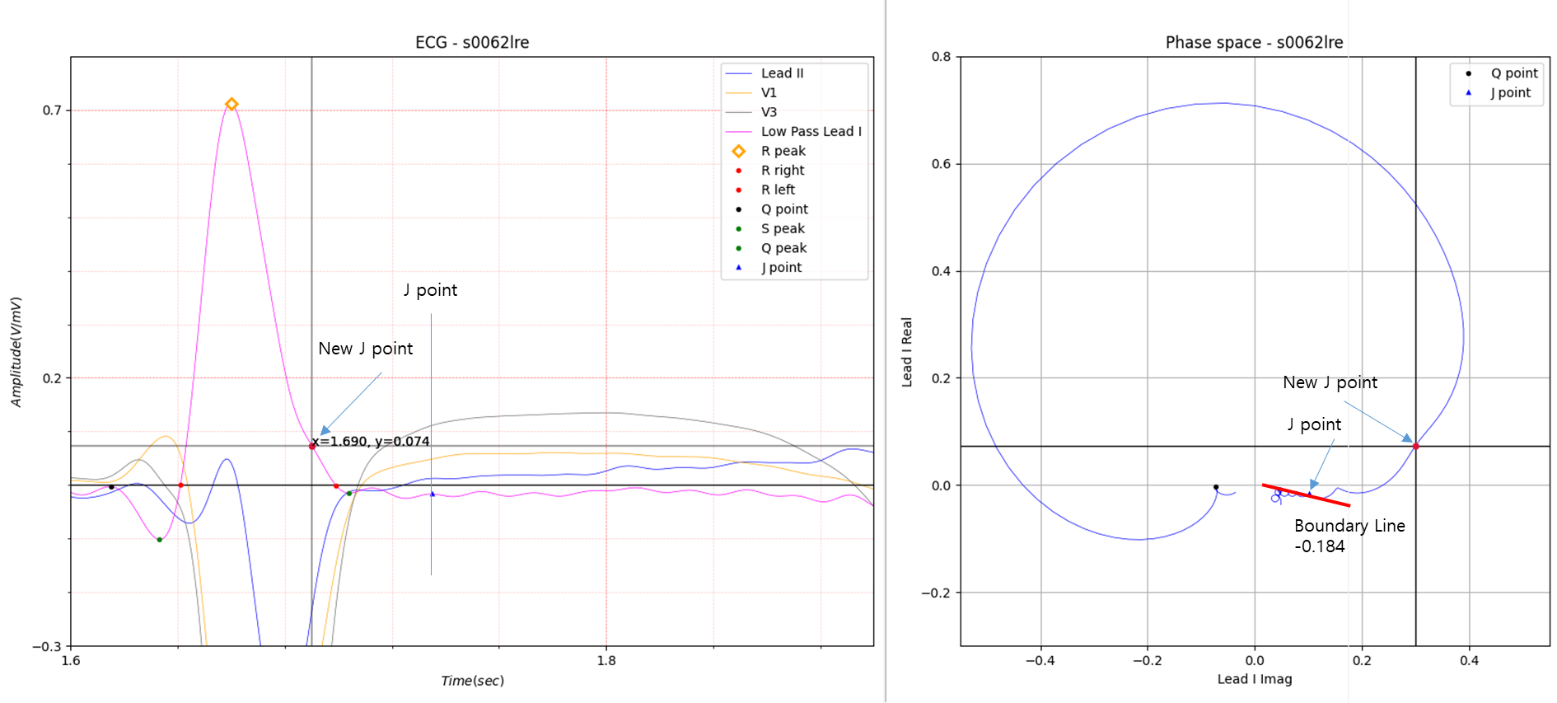
Fig.6 Boundary Line A
In Fig.6, there is a lot of noise in the ECG.
In case of a lot of noise, it can be analyzed by smoothing using numerical analysis, but it should be noted that
meaningful data will be lost.
Here, the results of applying the boundary condition when there is a lot of noise are shown.
In Figure 6, where case A in Figure 1 is applied, the New J point is indicated, but it is different from the J points of
Lead II, V1, and V3.
The Boundary Line shown in Figure 6 corresponds to the upsloping in Figure 5 with a slope of 0.184.
In phase space, it has an opposite slope to the electrocardiogram.
In this upsloping condition, the 2nd peak, not the 2nd valley, becomes the J point.
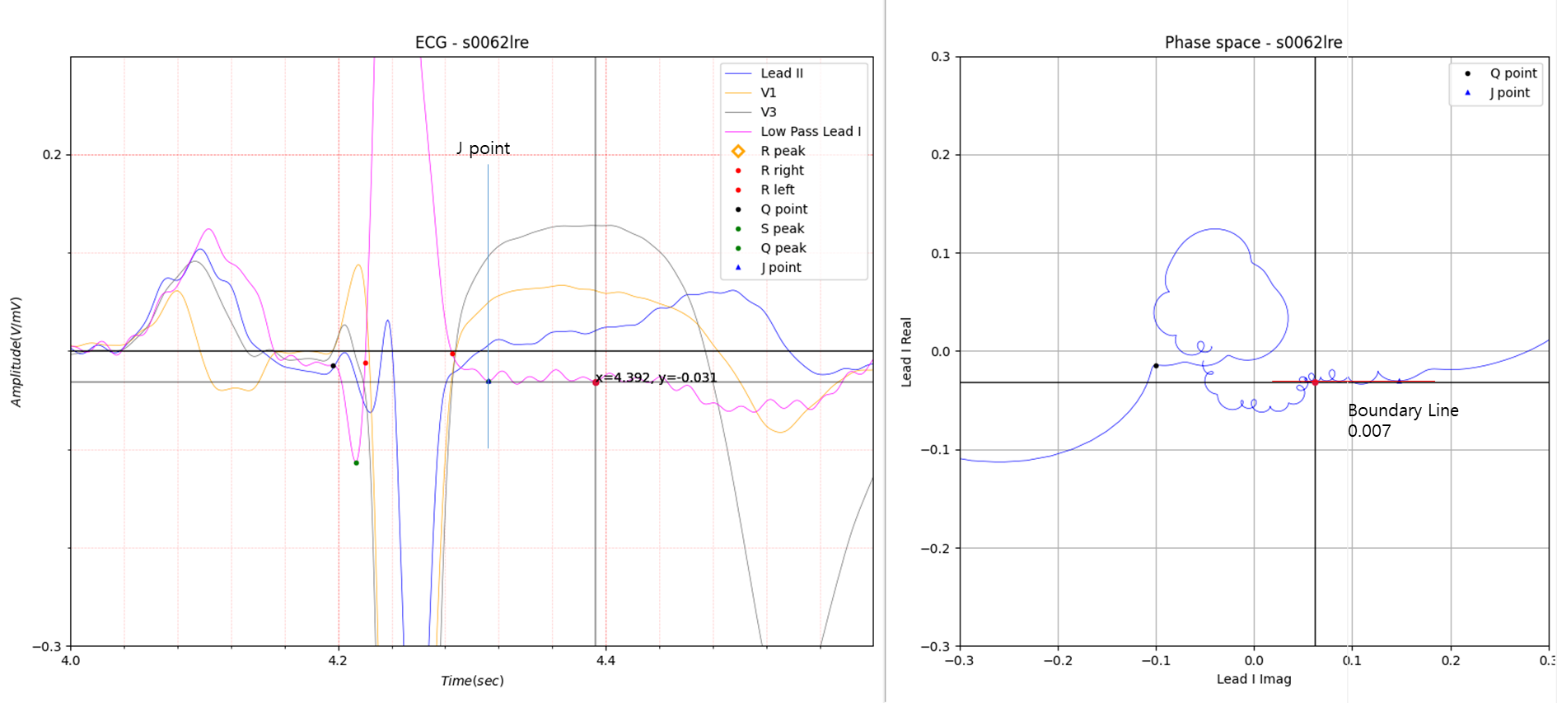
Fig.7 Boundary Line B
In Fig. 7, the Boundary Line becomes the horizontal case of Figure 5.
QRS duration of Case 1 110 120 117 103 116 115 112 113 116 119 111 114 113 105 114 110 111 113 117 101 115 109 113 110
109 112 112 108 113 114 114 114 113 116 112
Max:120 Min:101 Avg:112.4 std: 3.96
This result shows that the QRS duration is relatively scattered, even though there is a lot of noise.
Case 2. J poiont elevation
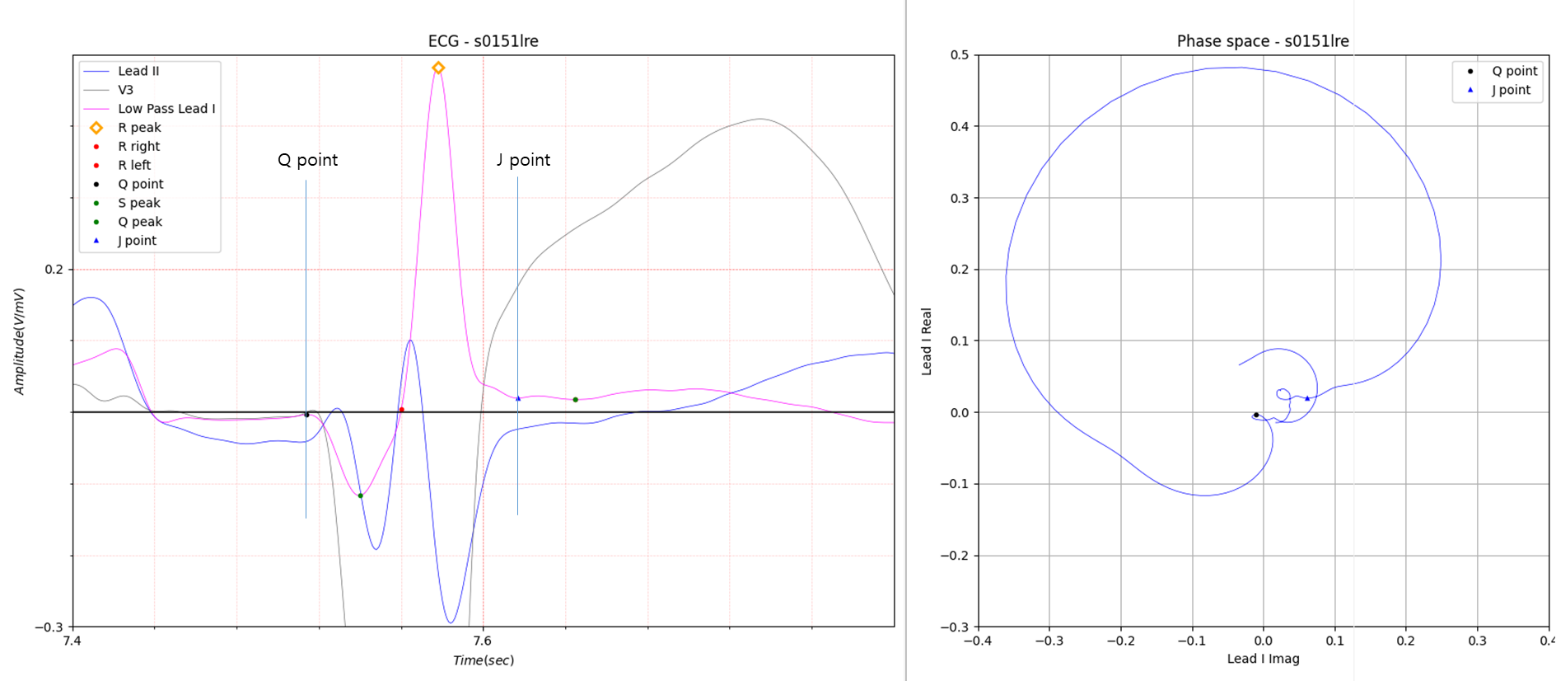
Fig.8 J point elevated
In Fig. 8, the J point is slightly elevated.
Fig. 6 to 8 show the J points of Lead I and other leads for comparison, and it can be seen that they are almost
identical. In Fig. 8, the Q point (start point of the QRS complex) location of Lead II appears different from that of
Lead I. Is the QRS duration of each lead different?
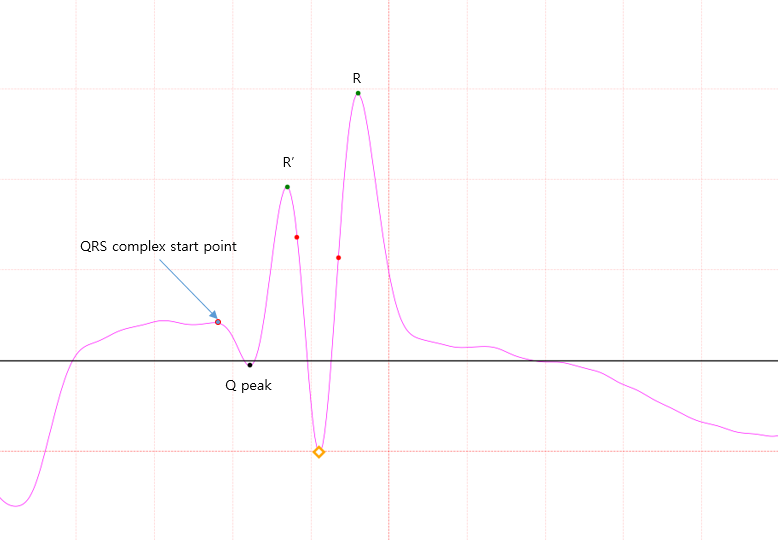
Fig.9 Reverse of Lead II
Figure 9 is the result of inverting the Lead II part.
Lead II can be thought of as reversed.
The inverted Q point location of Lead II is exactly the same as the Q point location of Lead I.
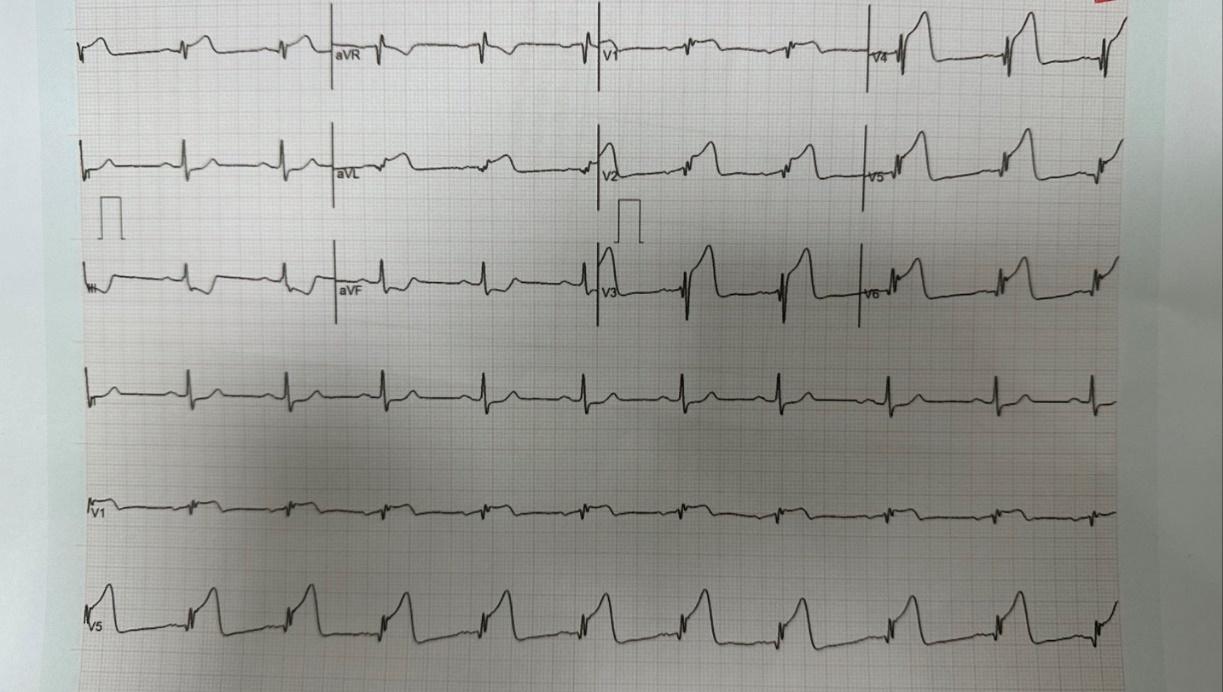
Fig.10 12 Lead ECG
I was laughed at by a renowned Korean electrocardiogram specialist when I told him that the QRS duration of all leads
had the same value. Most electrocardiograms are still used for reading in the form shown in Figure 10.
Since the electrocardiogram was discovered, there has been no advancement in electrocardiogram reading methods. Although
it is still a foolish claim, I will continue to try to verify this.
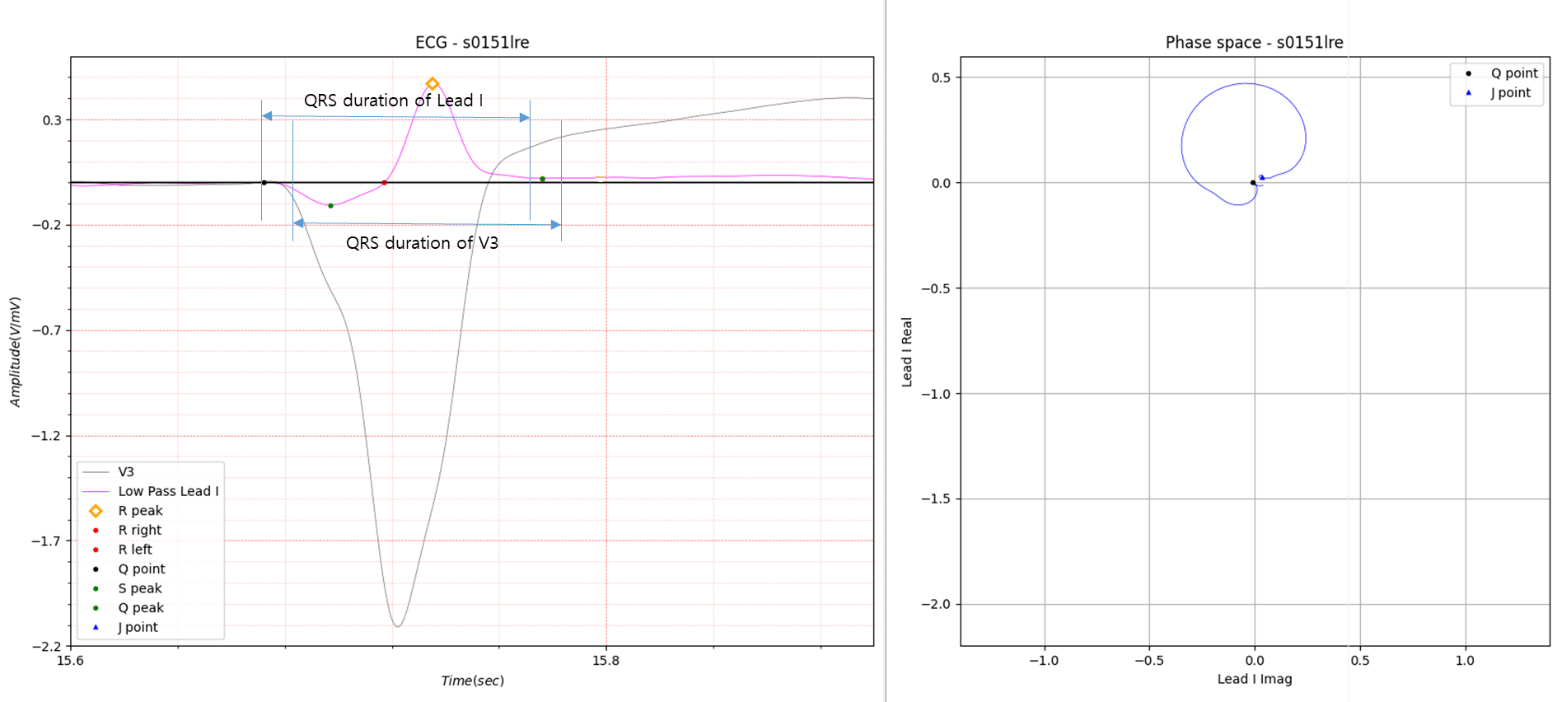
Fig.11 Example of shifted QRS duration
Fig. 11 shows an example where the QRS duration is shifted from a different lead. Although it is shifted, the QRS duration is the same.
Case 3. J poiont depressed
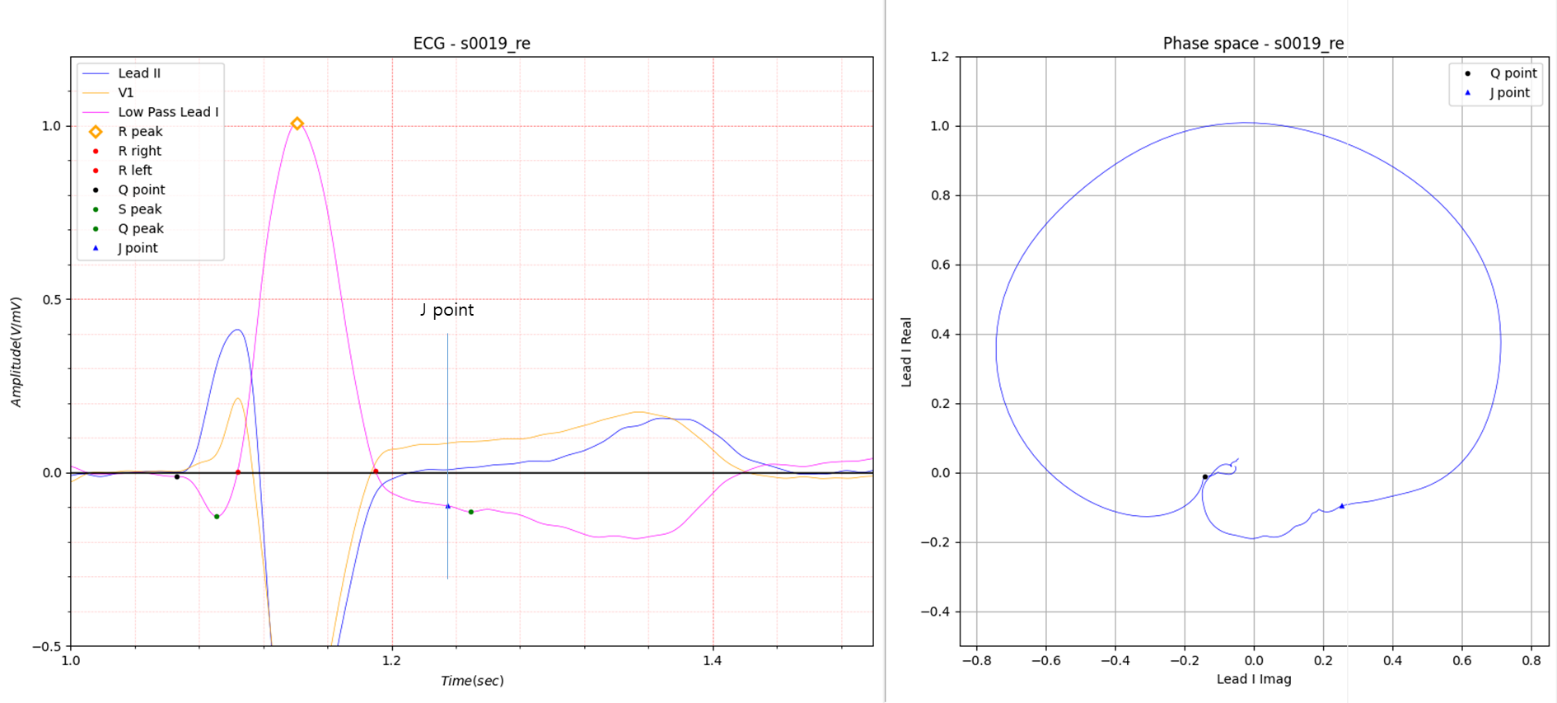
Fig.12 J point depression
In Fig. 12, the J point locations of Lead II and V1 may appear different.
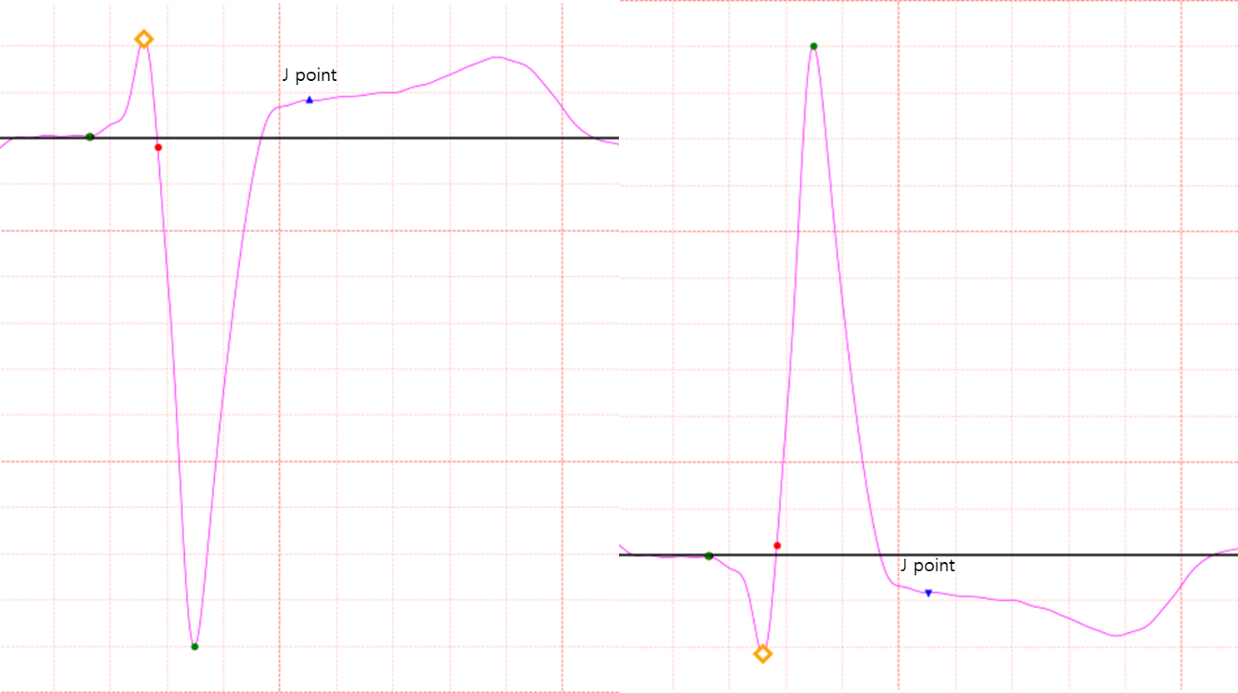
Fig.13 Reverse of V1
Fig. 13 The graph on the left is the ECG of V1, and the graph on the right is the inverted result.
If you look at the inverted graph, R peak changes to Q peak and S peak changes to R peak.
The location of the J point in the left graph of Figure 13 appears to be wrong, but the J point in the inverted graph is
completely normal.
Therefore, you should keep in mind that the J point will be different when you have a fairly deep S peak and when you
have a shallow S peak.
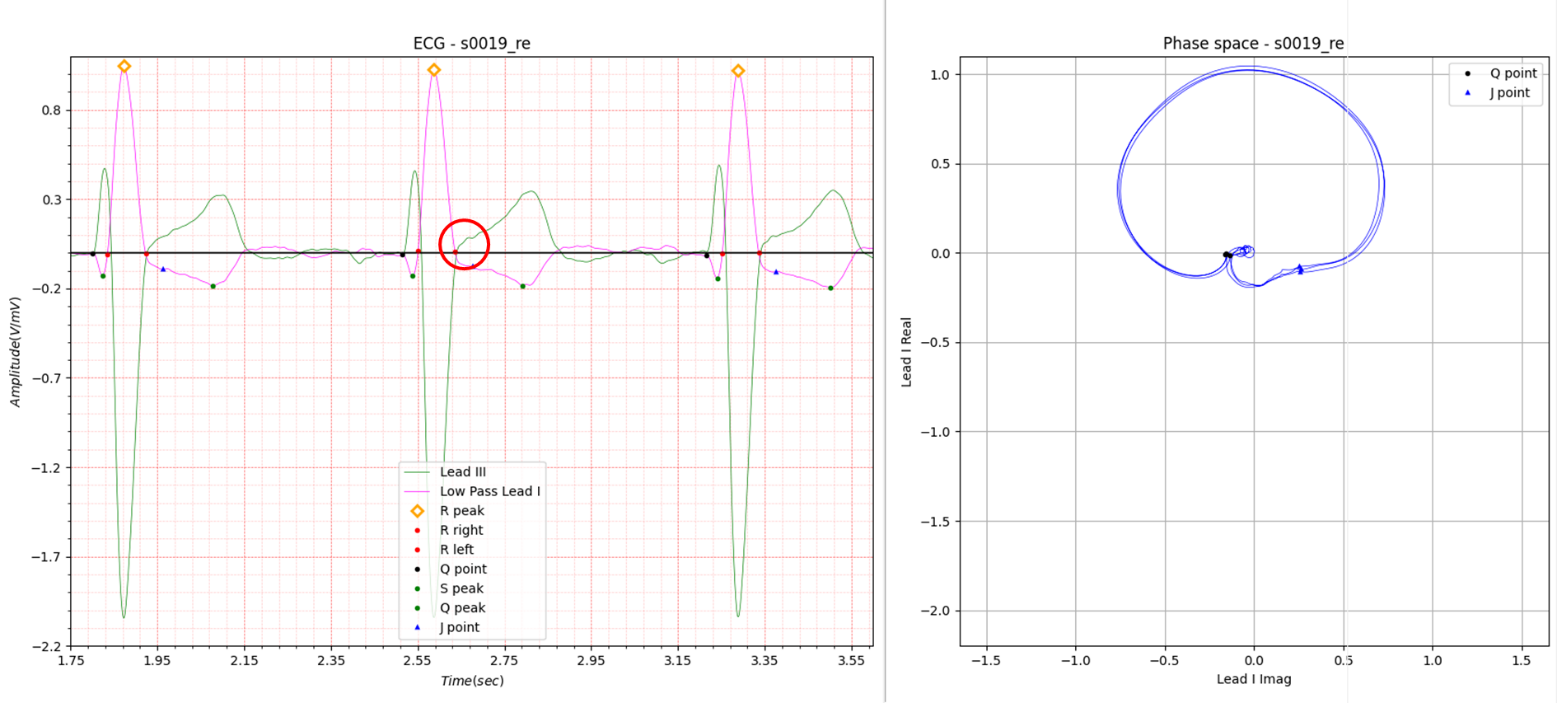
Fig.14 Lead I and III comparison
Fig. 12 is very zoomed in, so the shape of the slur is unclear.
Fig. 14 is zoomed out for the shape of the slur.
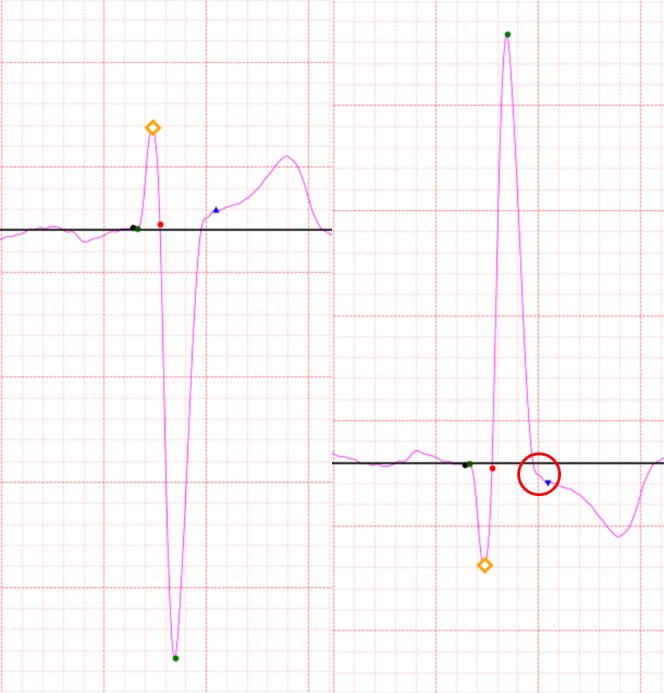
Fig.15 reverse of Lead III
In Fig. 15, Lead III is inverted and compared.