Projects ECG (Electrocardiogram) Monitoring
Atrial fibrillation
Atrial fibrillation detection using filters for T and P detect in phase space was briefly introduced.
(reference: T/P peak detect)
The location of the T and P peaks in the ECG where atrial fibrillation occurs is unclear. The method of storing data
structures was also very ambiguous.
What was considered more serious than that problem was the problem of how to determine the location of the peak when the
T and P waves are reversed or biphasic and the complexity of the program. There are more than 10 cases of T wave
morphology. The data structure for this morphology was also considered problematic. The enormous amount of coding for
the T wave portion reached a level where debugging was almost impossible. I took on a bold new task for simpler code and
easier debugging. It seemed necessary to first determine the start and end points of the QRS complex. Then I did the
filter design to detect T and P waves.
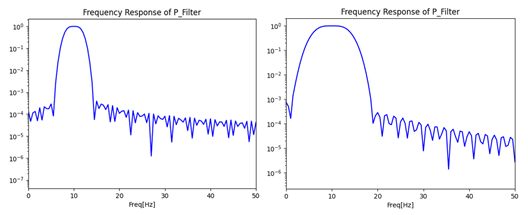
Fig.1 2 different filter characteristic
The design of the filter was set at 40 to 120 ms based on the period of the P wave. According to the setting value, the
filter characteristics on the left side of Fig.1 look good, but filters with narrow bands cause many problems.
The actual application adopts the filter characteristics on the right side of Fig.1.
After I decided to develop the electrocardiogram, I was careful not to infringe on many electrocardiogram-related
patents. This filter is also a very unique filter based on the method I created.
When Apple added an electrocardiogram sensor to its smartphone, many people predicted that a revolution would come in
mobile digital healthcare. There are many things blocking that rosy outlook, but the patent barrier is too high an
obstacle. So, most mobile ECG development companies seem to be trying to circumvent the barrier with AI. In fact, I
think it is possible to develop an electrocardiogram diagnosis system with AI. However, it feels like almost all
companies that started with smartwatches are turning to Holter monitor. Is there a problem with AI? I think the problem
is that AI developers do not know the importance of the signal analysis aspect of the ECG.
I often ask AI developers if they can do frequency analysis with AI.
Companies developing electrocardiograms based on AI will have AI developers, electrocardiogram experts, signal analysis
experts, and programmers working together organically.
However, in order to create a successful ECG diagnosis system, AI modeling developers must have sufficient knowledge of
signal analysis. I think I have enough knowledge in terms of signal analysis, but I lack an understanding of ECG. I get
advice from a few heart disease specialists, but it is limited.
For this reason, I want to collaborate with a company specializing in electrocardiogram diagnostic systems.
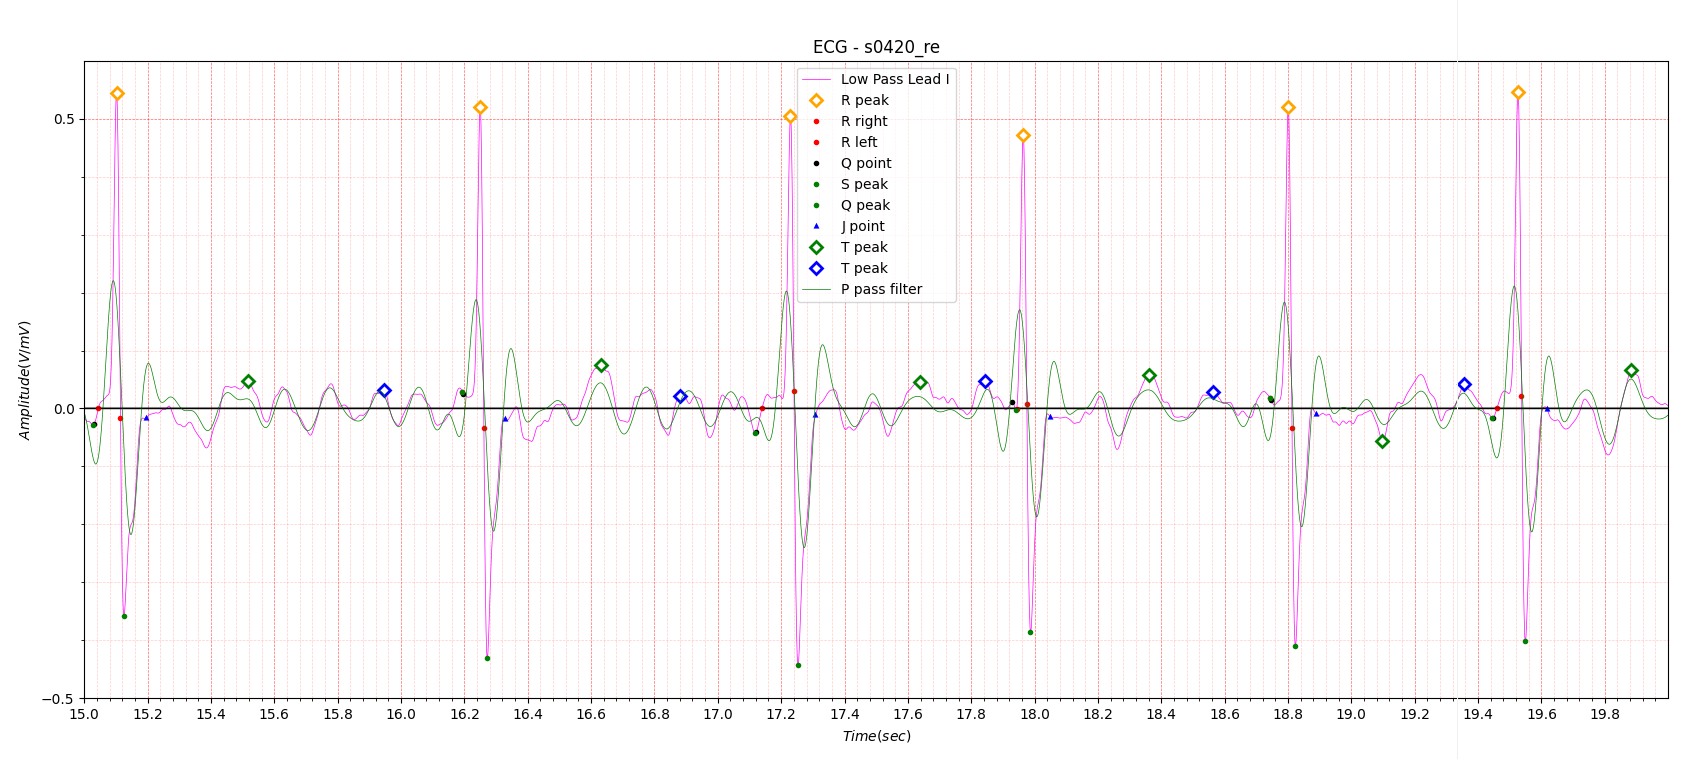
Fig.2 Example of AF filtering
Heart Rate: Avg: 74.6, Max: 111.1, Min: 43.2, std: 14.906
An example of finding atrial fibrillation using the filter introduced in Fig. 1 is shown in Fig. 2. However, we must not
forget that the filter used not only filters out the p wave, but also parts of the R and T waves. Let’s look at the
electrocardiogram of a normal person.
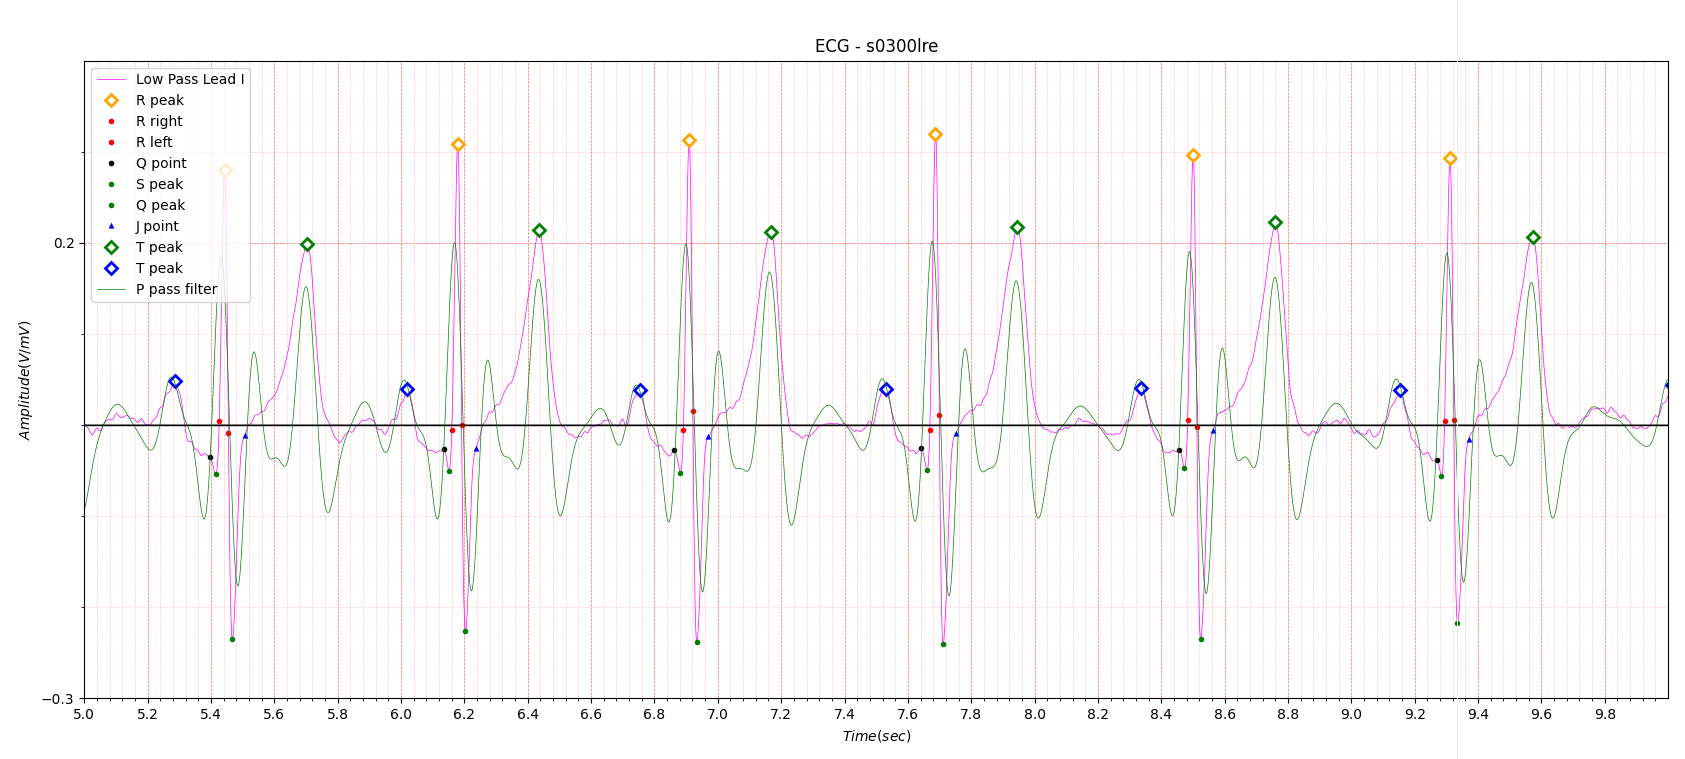
Fig.3
In the ECG in Fig. 3, the green line is the filtered signal. There is one peak after the deep S wave and another peak after the T wave peak that appears to be biphasic. The peak following the T peak can be thought of as a U wave, but it is not important.
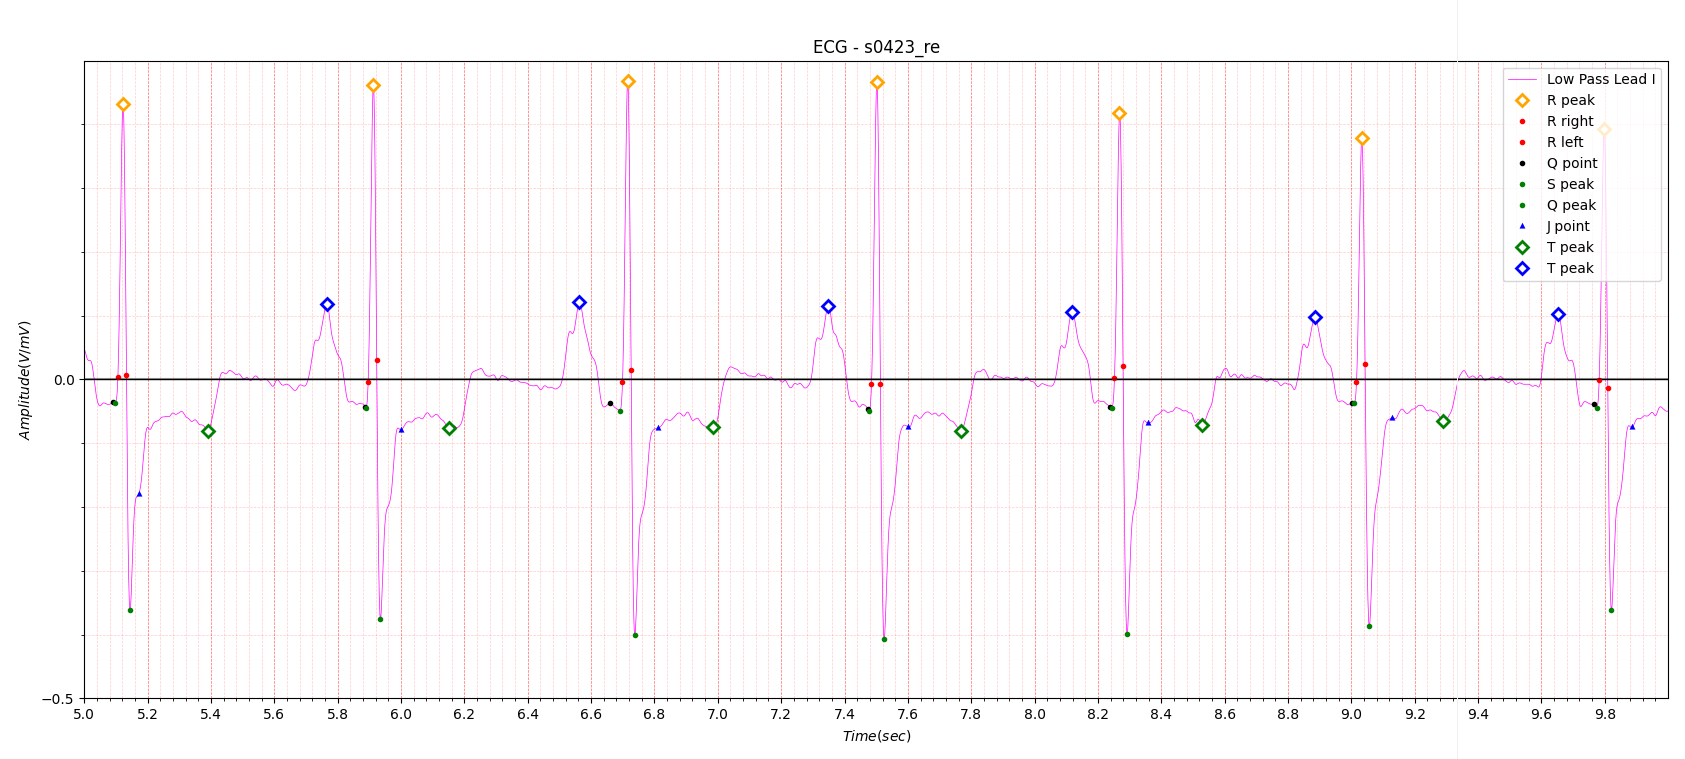
Fig.4 Cardiomyopathy with AF
Heart Rate:
Avg: 79.5, Max: 84.9, Min: 74.8, std: 2.093
# Reason for admission: Cardiomyopathy
# Acute infarction (localization): no
# Former infarction (localization): unknown
# Additional diagnoses: Atrial fibrillation, Hypertrophic cardiomyopathy
Figure 4 was diagnosed as atrial fibrillation.
In Appendix 1, the characteristics of atrial fibrillation are described as Irregularly irregular rhythm.
Figure 4 Heart Rate of ECG: Avg: 79.5, Max: 84.9, Min: 74.8, std: 2.093 has normal rhythm.
Detection of atrial fibrillation is relatively easy due to irregular heart rate, but the case shown in Figure 4 is very
difficult.
Appendix 2 introduces the relationship between Cardiomyopathy and Atrial fibrillation.
Additionally, myocardial infarction may also be related to atrial fibrillation.
Cardiomyopathy generally has a very weak positive T wave.
The results using the P wave filter are shown in the following figure.

Fig.5
A slightly raised peak is visible after passing the deep S wave. At present, it is unclear whether this peak is related to atrial fibrillation.
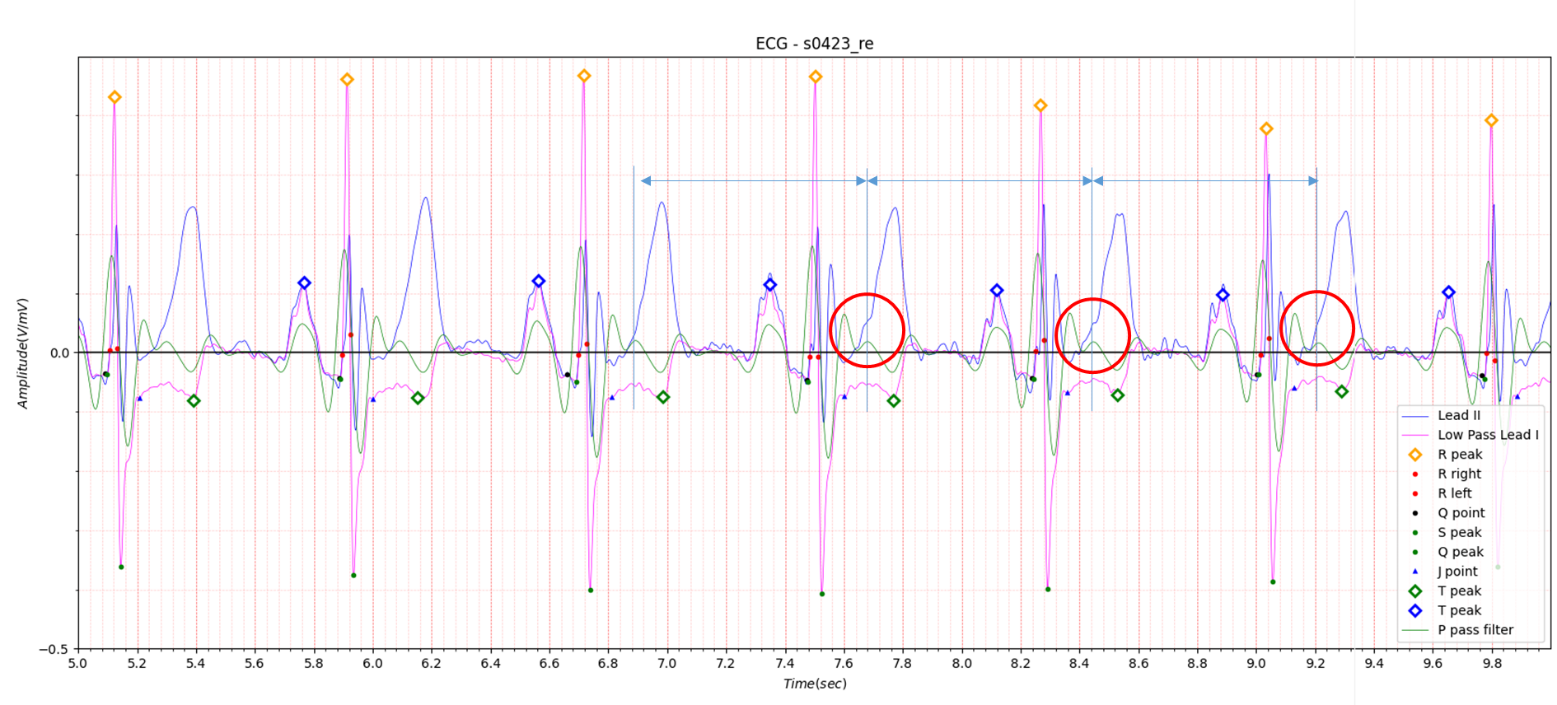
Fig.6
Lead II is shown overlaid in Figure 6.
The suspicious-looking peaks are spaced evenly apart. Looking at the red circle in Figure 6, the peak slightly distorts
the T wave of Lead II.
From this, it is clear that two P waves exist.
If you look at Appendix 3, AV block: 2nd degree, “fixed ratio” blocks
It may be viewed as a 2:1 block, but much literature stipulates that the heart rate for 2:1 block is 60 or less.
In this regard, advice from an electrocardiogram expert is absolutely essential.
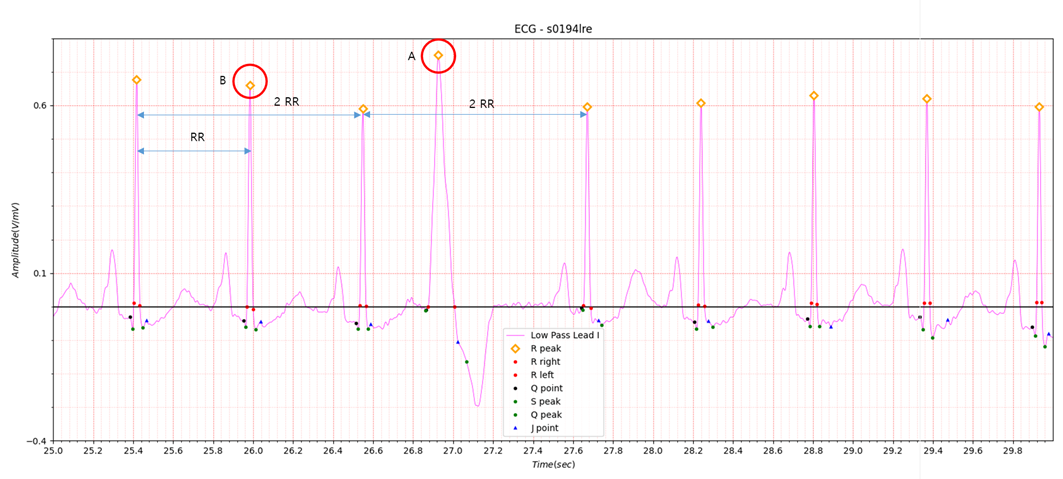
Fig.7 Myocardial infarction with AF
Heart Rate:
Avg: 91.4, Max: 123.0 , Min: 47.6, std: 13.849
# Reason for admission: Myocardial infarction
# Acute infarction (localization): no
# Former infarction (localization): anterior
# Additional diagnoses: Dilated Cardiomyopathy secondary to coronary artery disease. Mitral regurgitation (grade 2),
Tricuspid regurgitation (grade 2), Atrial fibrillation.
In the case of atrial fibrillation accompanied by myocardial infarction,
Heart Rate: Avg: 91.4, Max: 123.0, Min: 47.6, std: 13.849 has a large standard deviation, so there is no major
difficulty. This is a combined case of myocardial infarction, dilated cardiomyopathy, and atrial fibrillation.
Dilated Cardiomyopathy is briefly described in Appendix 4.
Appendix
1. ECG Features of Atrial Fibrillation
- Irregularly irregular rhythm
- No P waves
- Absence of an isoelectric baseline
- Variable ventricular rate
- QRS complexes usually < 120ms, unless pre-existing bundle branch block, accessory pathway, or rate-related aberrant
conduction
- Fibrillatory waves may be present and can be either fine (amplitude < 0.5mm) or coarse (amplitude> 0.5mm)
- Fibrillatory waves may mimic P waves leading to misdiagnosis
2. Atrial Fibrilliation (AFib) & Cardiomyopathy - symptoms & treatment (dcmfoundation.org)
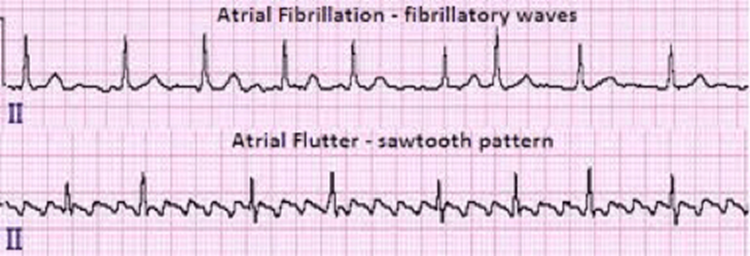
The upper electrocardiogram (ECG) shows atrial fibrillation. Note that the pattern is irregular. The bottom ECG shows atrial flutter, which is often more regular than atrial fibrillation and has a “saw tooth” pattern between the QRS complexes.
Atrial Fibrillation
Atrial fibrillation is the most common abnormal heart rhythm, which commonly occurs in those who do not have DCM
(Dilated Cardiomyopathy) and more frequently in people as they age. It also commonly occurs in individuals with DCM, and
when it does, can be a major problem. The heart function, which may already be reduced, can be reduced further when
atrial fibrillation is present and heart failure symptoms may then worsen. Atrial fibrillation is caused by a lot of
electrical stimulations in the atria. They occur randomly and rapidly, causing the heart’s rhythm to be irregular and
often fast. They can be a cause for palpitations (feeling of the heart beating fast, hard, pounding, fluttering).3. AV block: 2nd degree, “fixed ratio” blocks
Fixed Ratio AV blocks
Second degree heart block with a fixed ratio of P waves: QRS complexes (e.g. 2:1, 3:1, 4:1).
Fixed ratio blocks can be the result of either Mobitz I or Mobitz II conduction.
2:1 block
- The atrial rate is approximately 75 bpm.
- The ventricular rate is approximately 38 bpm.
- Non-conducted P waves are superimposed on the end of each T wave.
4. Dilated Cardiomyopathy | Johns Hopkins Medicine
What is dilated cardiomyopathy?
Dilated cardiomyopathy, or DCM, is when the heart chambers enlarge and lose their ability to contract. It often starts in the left ventricle (bottom chamber). As the disease gets worse, it may spread to the right ventricle and to the atria (top chambers). As the heart chamber widens, it becomes weak and does not contract well. Eventually, the heart can't pump as much blood forward as it normally would. This causes fluid to back up in the lungs and build up in the body. This is called heart failure.