Projects ECG (Electrocardiogram) Monitoring
QT interval I
Previous studies have already shown that patients with coronary artery disease have a larger QT interval than people
without coronary artery disease. The QT interval refers to the time from the beginning of the Q wave to the end of the T
wave, and is the interval from the start of contraction of the ventricle to the end of relaxation. Coronary artery
stenosis causes myocardial ischemia, and myocardial ischemia increases the QT interval by varying the repolarization
time of ventricular cells.
* QT prolongation
For males and females below 15 years of age:
- Normal QT interval: 0.35-0.44 seconds
- Borderline QT interval: 0.44-0.46 seconds
- Prolonged QT interval: More than 0.46 seconds
For adult males:
- Normal QT interval: 0.35-0.43 seconds
- Borderline QT interval: 0.43-0.45 seconds
- Prolonged QT interval: More than 0.45 seconds
For adult females:
- Normal QT interval: 0.35-0.45 seconds
- Borderline QT interval: 0.45-0.47 seconds
- Prolonged QT interval: More than 0.47 seconds
The QT interval may be prolonged due to various factors, so it cannot be easily determined that the prolonged QT
interval is caused by cardiovascular disease.
When I first became interested in QT prolongation, I wanted to monitor healthy people without cardiovascular disease for
a long time and alert them to danger signals when the QT interval approaches the borderline.
However, even if a patient with cardiovascular disease recovers completely with appropriate treatment, there is a
possibility of recurrence of cardiovascular disease, so it was necessary to measure QT prolongation more accurately by
including patients with cardiovascular disease as monitoring subjects.
In this post, I introduce the existing QT interval measurement method and find out what problems it has.
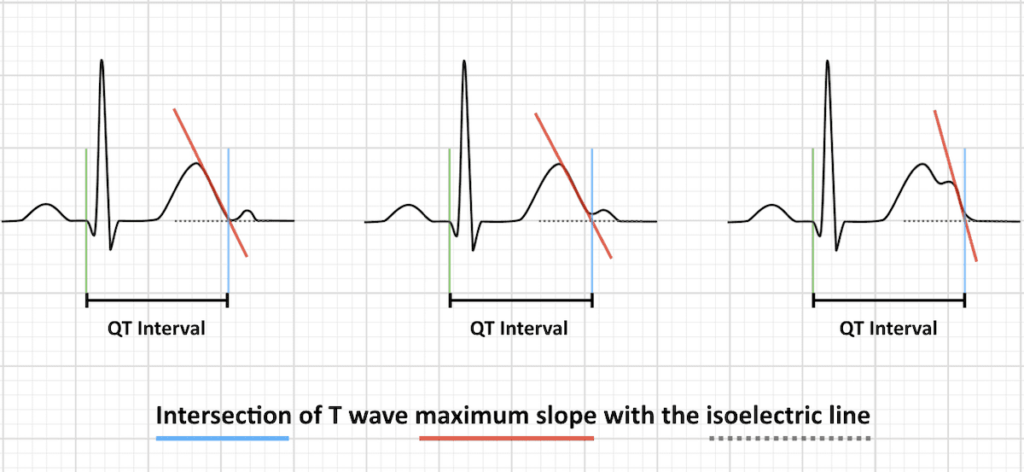
Fig.1 QT Interval • LITFL • ECG Library Basics
Left, middle: Smaller U waves and those that are separate from the T wave should be excluded from measurements
Right: Large U waves that are fused to the T wave should be included in measurements
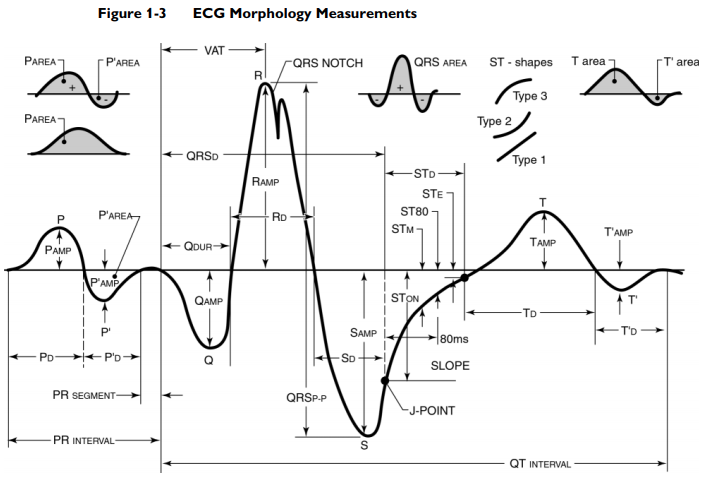
Fig.2 The Philips 12-lead Algorithm Physician's Guide
If you search the Internet, many materials explain the QT interval end point as intersection of T wave maximum slope with the isoelectric line, as shown in Fig.1. For a long time, this would have been the most convenient way for ECG specialists to visually check. The digital data of the actual ECG is much more complex than the graph drawn on the printed ECG. And the maximum slope can have a significant problem if noise is involved in the high-precision digital data of the ECG.
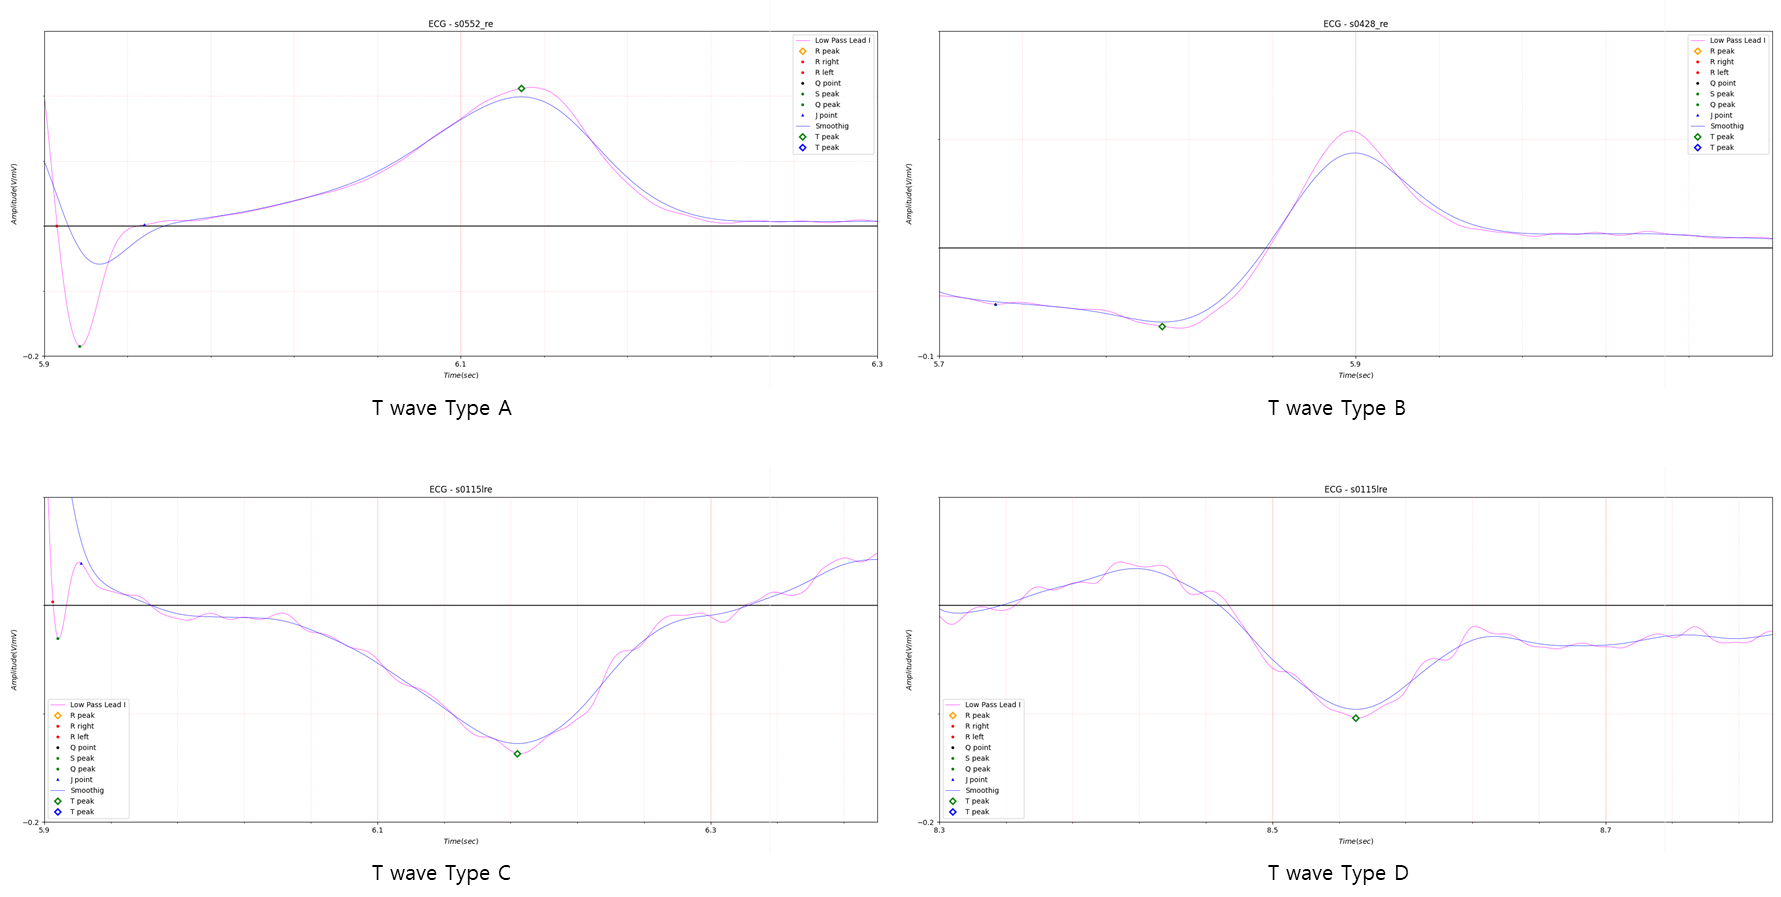
Fig.3 T wave type
As shown in Fig.3, I divided the T wave into four types. The actual T wave has a more complex aspect, but it is used to
determine whether the peak of the T wave at the start point of the T wave is positive or negative, and conversely,
whether the peak before the end point of the T wave is positive or negative.
The four types in Fig.3 are convenient when determining the start point and end point of a T wave using phase space.
Fig.2 appears to illustrate the case of a T wave that is close to biphasic, such as T wave type D in Fig.3. If applied
when T' in Fig.2 is below a certain size compared to T peak, the QT interval will be too long compared to other leads.
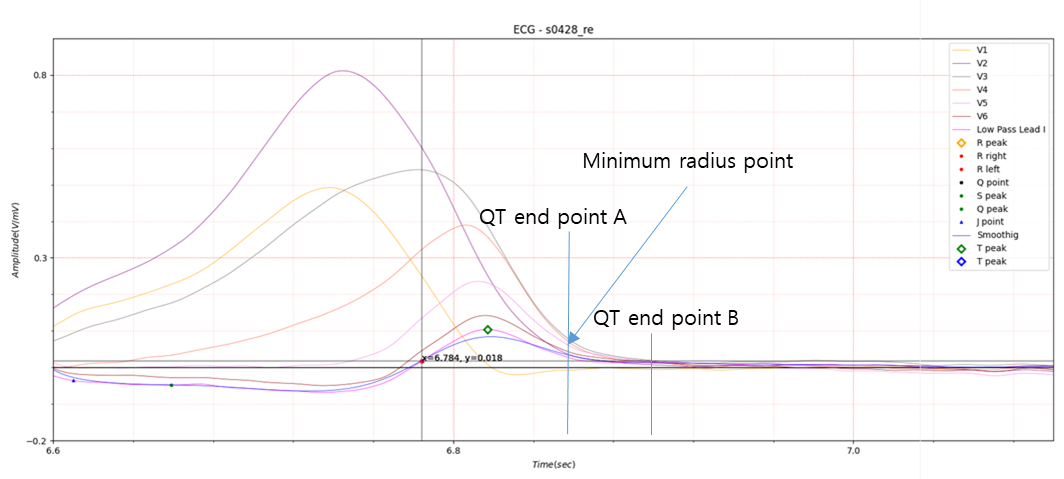
Fig.4 QT interval end point
Assuming that the QT interval start point of all leads is the same, the QT interval endpoint will be gathered at one point. QT end point B in Fig. 4 shows that all leads meet at one point. If the Prolonged QT interval is determined based on QT end point B, there will not be much difficulty in determining the QT interval. Lead V1 corresponds to T’ in Fig. 2, which also meets QT end point B. QT end point A represents the minimum radius point of the curve where the T wave descends, and except for V1, it represents an almost constant position.
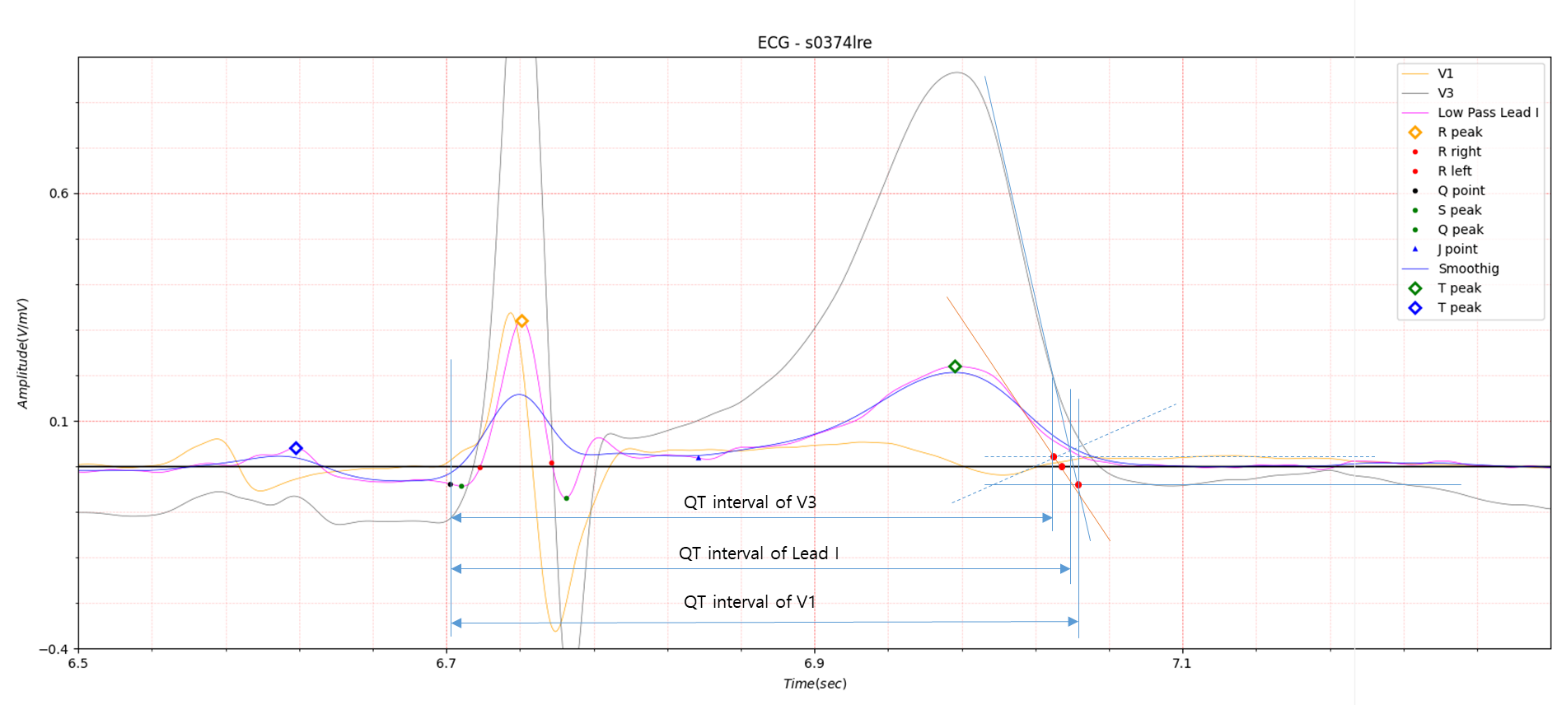
Fig.5 QT interval using Max. slope
Figure 5 shows that the QT interval is somewhat dispersed. If the QT interval of each lead is determined as the Prolonged QT interval using the average value, there does not seem to be much of a problem.

Fig.6
If determining the QT interval end point using maximum slope has become the standard, an ECG analysis system based on a
single lead will face a very difficult problem. This is because the single lead used can never be the average value of
all leads.
To calculate the QT interval using a single lead, a Prolonged QT interval standard must be created based on a single
lead or a method must be found to approximate the average value of all leads.
The minimum radius of curvature shown in Fig. 4 represents the average of the QT interval end points of all leads and is
schematized in Fig. 6. Obtaining the minimum radius of curvature from actual ECG data is meaningless due to noise. A
skilled person can easily roughly catch the location when looking at it with the eyes, but it is impossible to make a
computer recognize the concept of roughness. In Fig. 6, because data using smoothing was used to remove noise, the
result is close to a circle, and as a result, it is difficult to obtain the minimum curvature. For that reason, I tried
to obtain the point of minimum curvature by introducing a slope line in phase space.
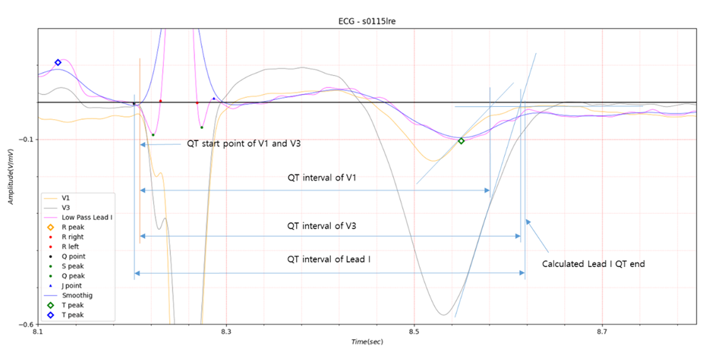
Fig.7
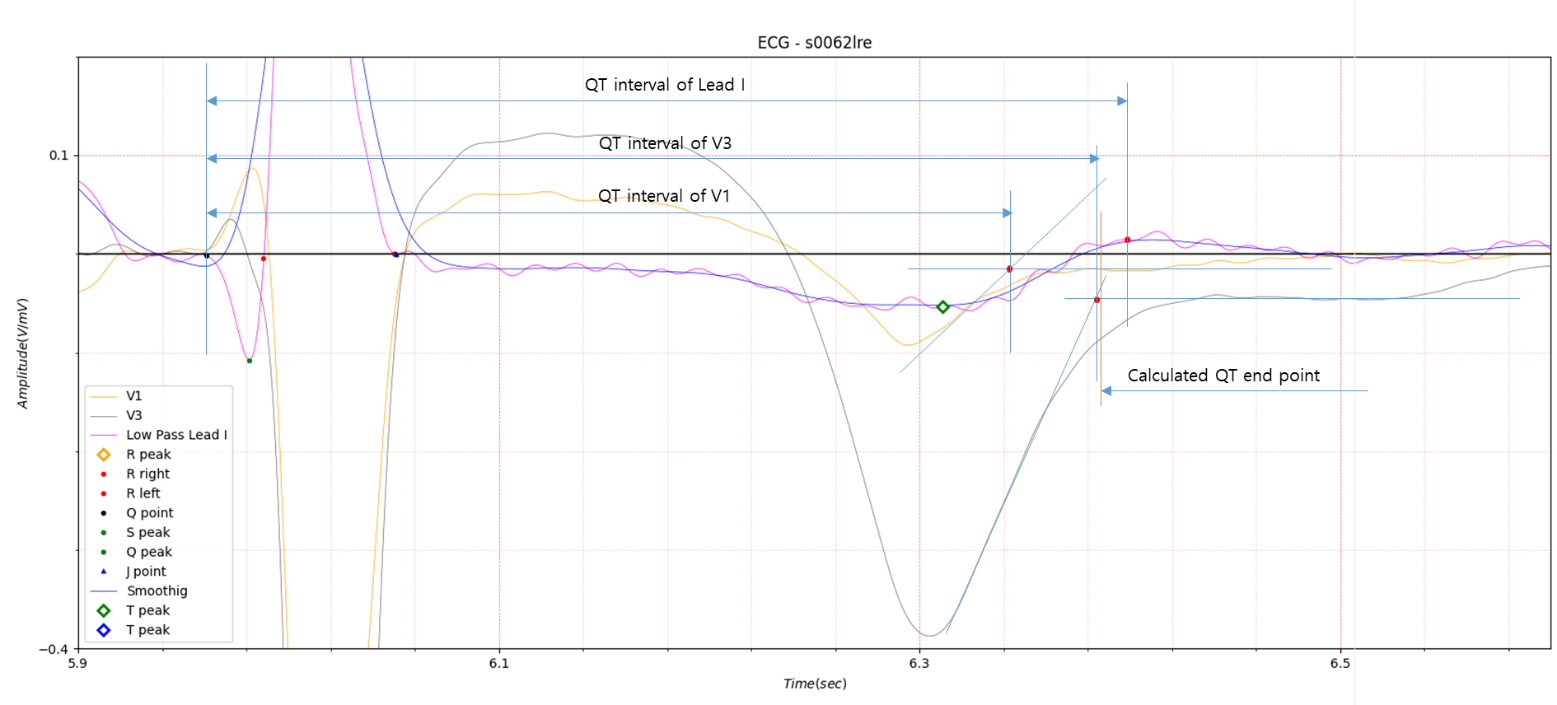
Fig.8
Fig.7 and Fig.8 show the QT interval obtained using the method used in Fig.6. Looking at the above results, it is difficult to say that the result calculated from a single lead has the average value of all leads. A little more adjustment is needed. The software created for electrocardiogram analysis is based on Lead I, so obtaining the QT interval of other leads requires a slightly cumbersome process.
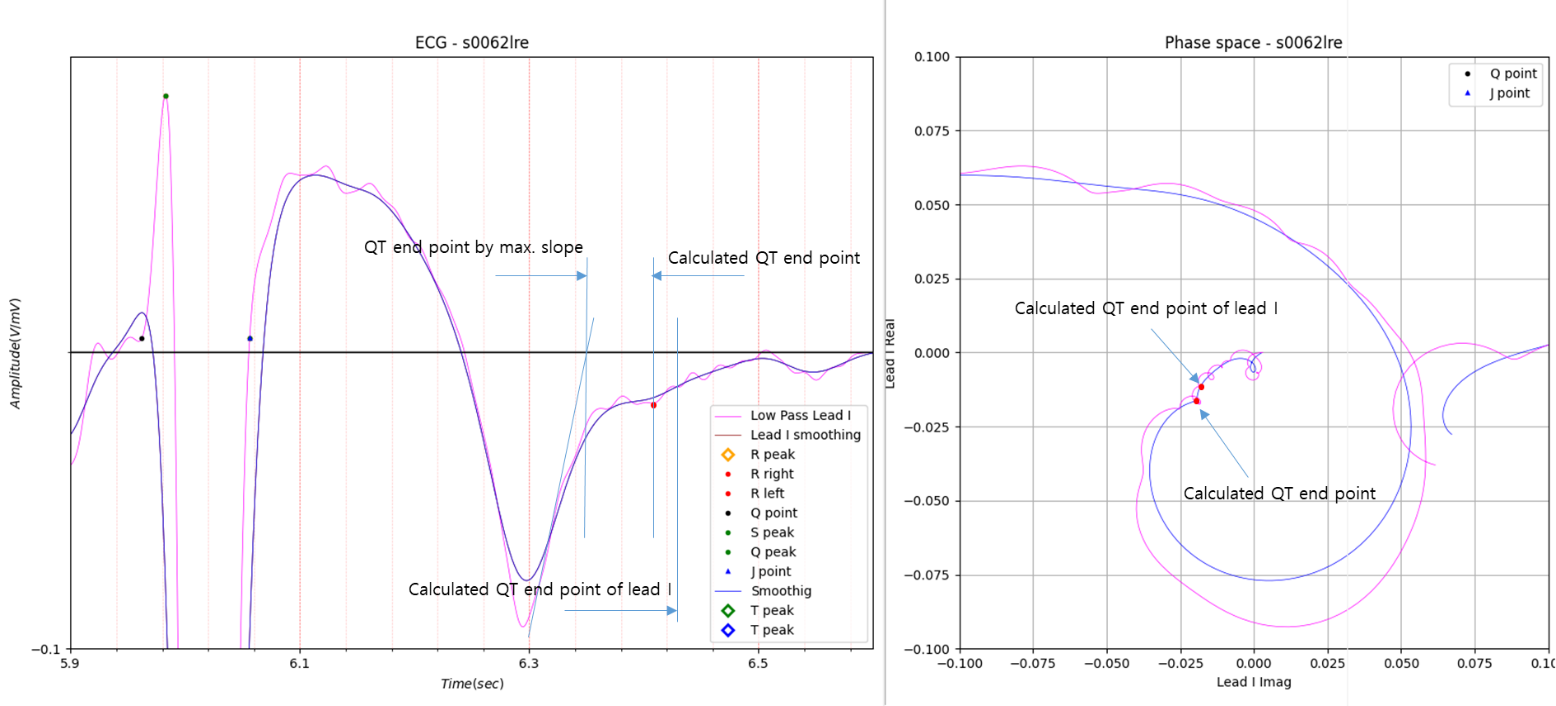
Fig.9
Fig.9 shows the results of analyzing V1 in Fig.8. The legend of the graph is marked with Lead I. This is because the diagnostic system I created is based on Lead I.
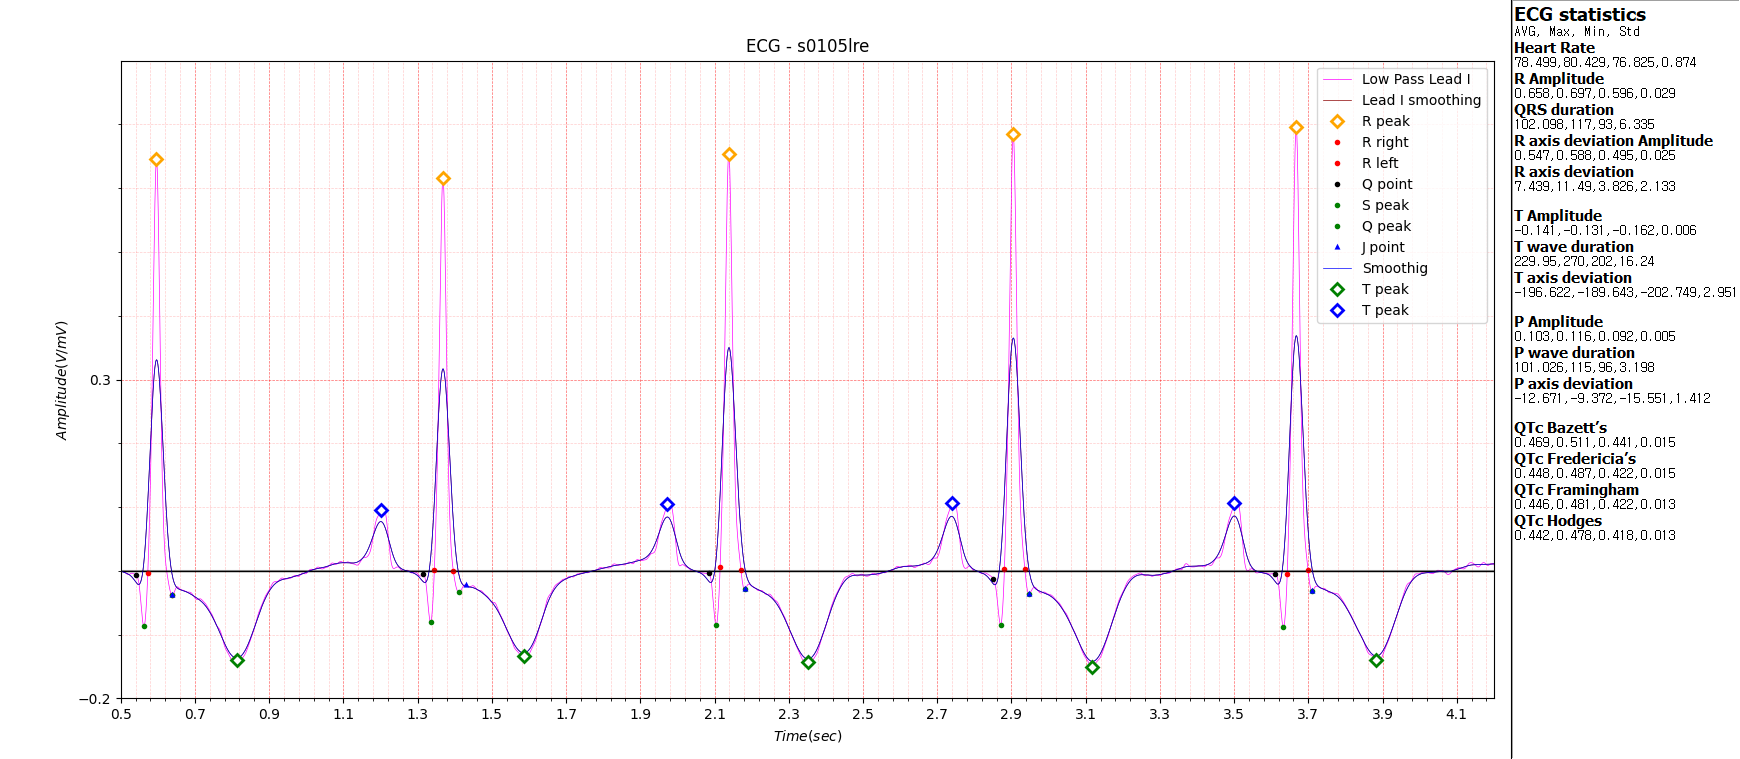
Fig.10
Currently, four methods of Corrected QT Interval are being introduced.
Fig.10 shows the calculation results of all four methods.