Projects ECG (Electrocardiogram) Monitoring
The start and end points of a QRS complex using imaginary numbers

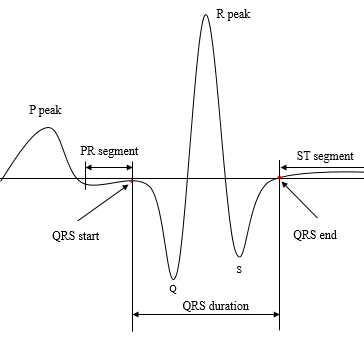
Fig.1 The organization of QRS complex

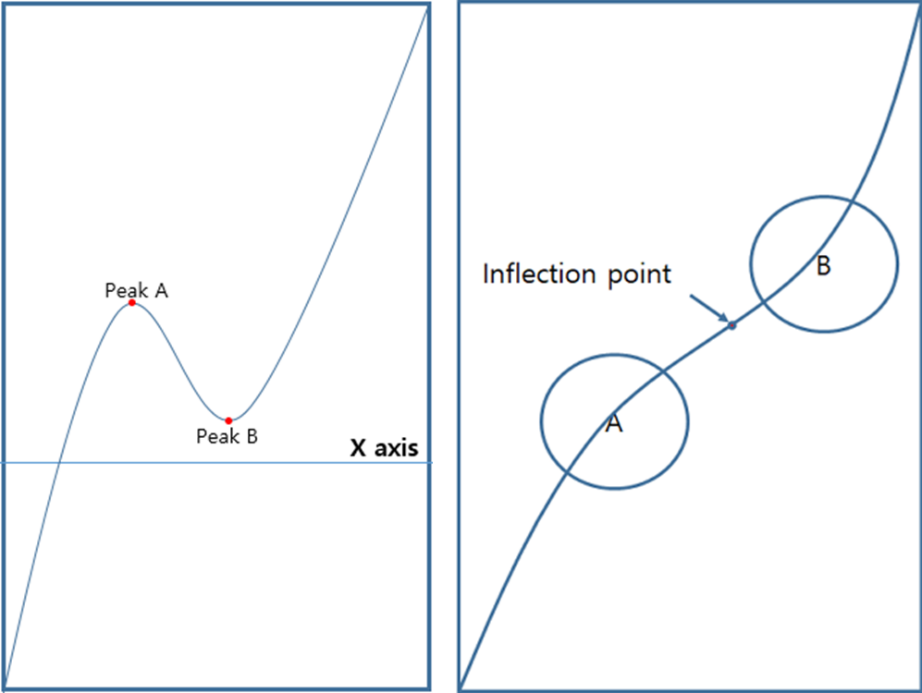
Fig.2 Find pea
In Figure 2, there are two graphs, both of which are cubic functions.
The difference between the two graphs is that the peak of the cubic function is visible in the left graph, but not in
the right graph. The invisible peak in the right graph exists in complex number space. All signals are actually composed
of complex numbers. Let's take the sine function as an example.
The sine function is composed of the following complex numbers

Any signal can be represented as a combination of simple signals, and these simple signals can be represented as sine
waves. The sine graph we often see is the result of projecting a complex sine function onto a real axis.
So the ECG graph we are looking at is also a projection of a complex coordinate system onto a real axis.
Now, how do we find the imaginary part and organize the phase space?
One way to find the imaginary part is to think of the Hilbert transform.
In the graph on the right in Figure 2, we can use numerical analysis to find a polynomial, which can then be used to
find the imaginary roots.
The Hilbert transform that follows is for illustrative purposes only, and a patent should cover any method that uses
imaginary numbers to find the imaginary roots in a case like the graph on the right in Fig.2.
1. Find QRS start point

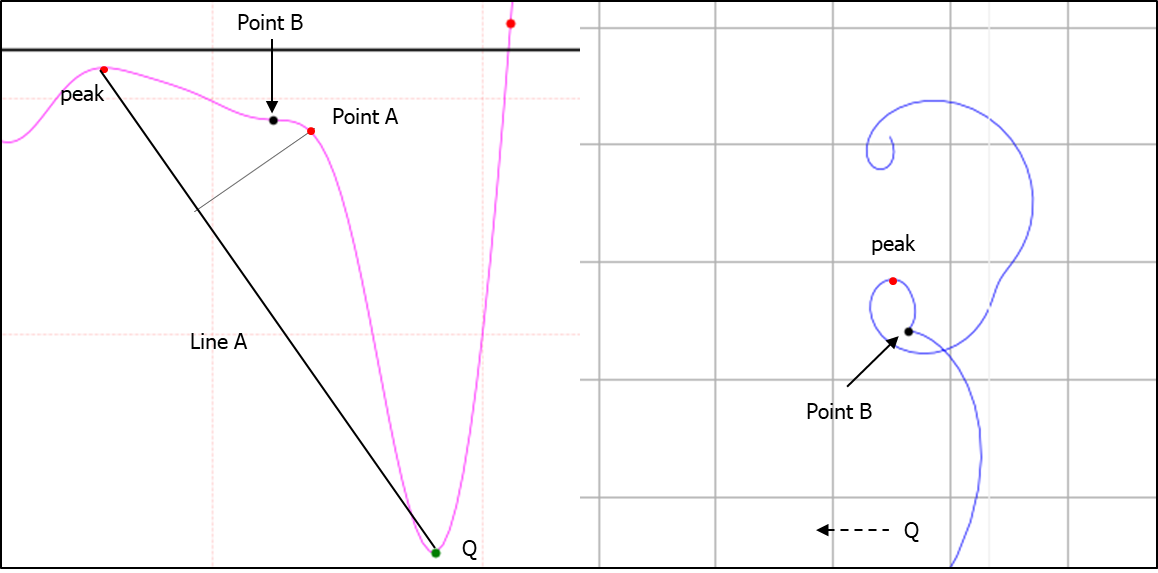
Fig.3 Find Q peak
The graph on the right in Fig.3 is an XY graph with the imaginary part obtained through the Hilbert transform on the x-axis and the electrocardiogram on the y-axis. The peak is the peak at the end of the PR segment. In some cases, there is no actual peak.
On the left side of Fig.3, Point A sticks out unnaturally. While this is easy to see for the human viewer, the ECG software has to make a judgment based on the data in the ECG, so it has to make a numerical judgment about the unnatural protrusion.
An easy way to think of it is in terms of inflection points. On the left side of Figure 3, if the inflection point of the curve that makes up the peak and Q is 1, the curve is a cubic function and the peak is the QRS start point. However, if the inflection point is greater than 1, the curve is quadratic or higher and has an unnatural jagged shape.
The left plot in Fig.3 is a fifth-order function (inflection point 3). After finding the inflection point and confirming that there is an unnatural bulge, we still have a problem.
The QRS start point is known to be the point of descent towards Q. However it's hard to define exactly where that point of descent is.
In the graph on the left in Figure 3, it is argued that if Line A is drawn and the point farthest from the straight line is called Point A, then Point A is the QRS start point.
Consider the right graph in Fig.3.
There is a vertex labeled Point B on the curve going clockwise from the peak. This is the vertex that is not found in the normal ECG on the left in Fig.3. Point B is the QRS start point.
2. Find QRS end point

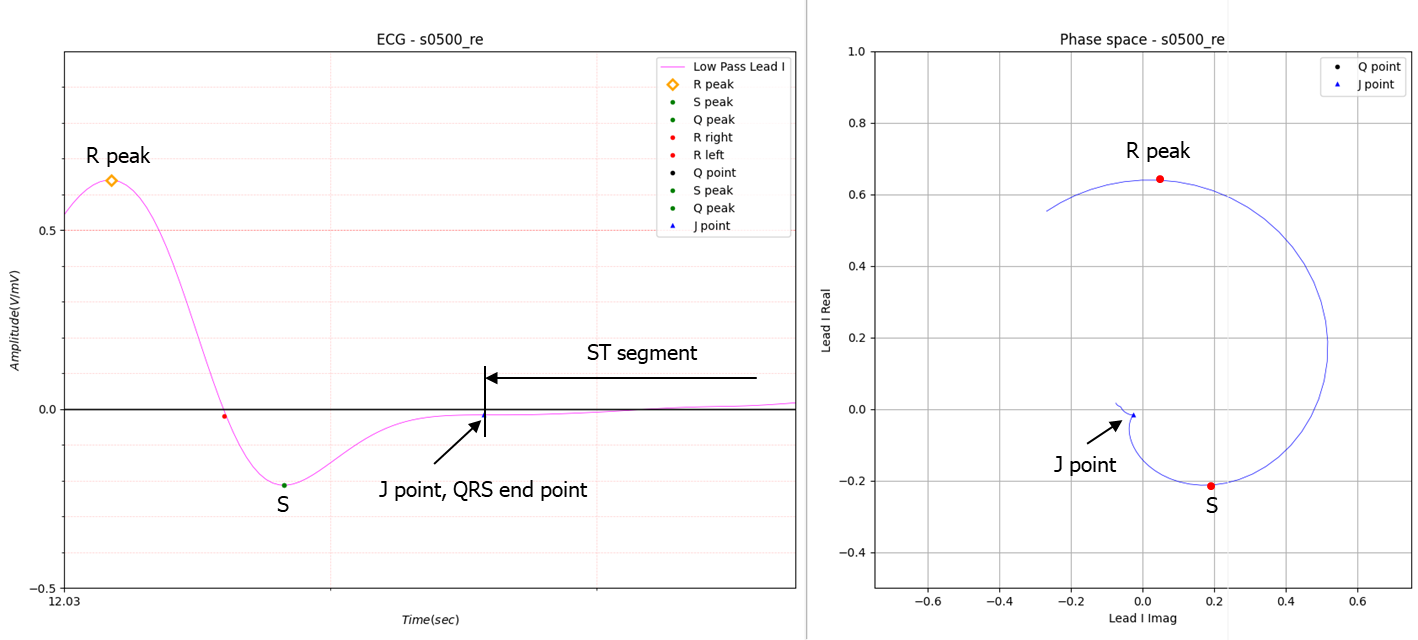
Fig.4 Find J point
The J point in Fig.4 represents the QRS end point. The process is the same as finding the Q point.
Summarize the terminology used here.
The J point is the end of the S wave and the start of the ST segment.
Fig.4 shows an example of finding the QRS end point by taking an imaginary root using phase space when no peak exists at the end of the S wave.