Projects ECG (Electrocardiogram) Monitoring
Myocardial infarction IV
In this post, I will summarize the key factors for MI related to anterior.
1. anterior
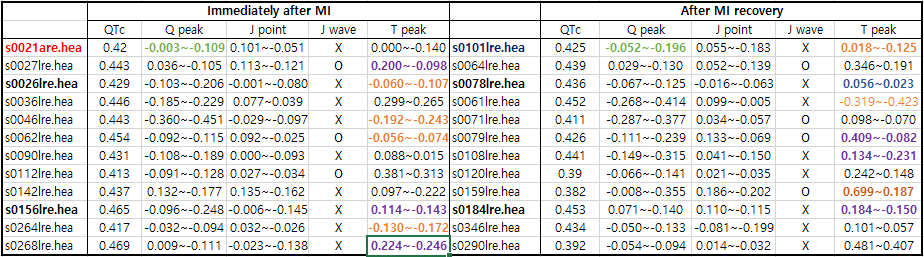
Table 1. anterior
Note:
Former infarction: s0022lre(inferior ?),s0142lre(anterior),
In data name: red color Myocardial infarction II or Myocardial infarction III introduced
Q peak: green color Delta wave
T peak: purple color T wave positive or negative orange color
T wave reversed
The QTc shown in Table 1 is less reliable when the T wave height is below 0.1, exhibits complex variations, or is
heavily noise-interrupted.
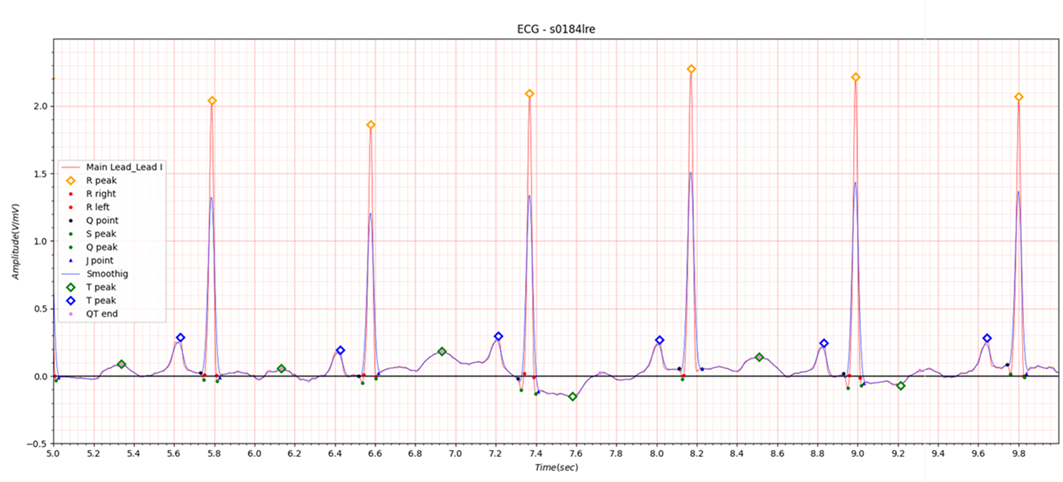
Fig.1 s0184lre example of purple color
For Lead I in anterior MI, if the T wave is lower than 0.15, even values as small as Q peak -0.1 J point 0.05 should be noted. In the PTB database presented in the table, there is no pre-MI ECG data, so the T wave morphology before MI is unknown. If the T wave is suddenly lowered by cyclic motivation, it should alert you to perform an ECG measurement in the heart segment (V3).
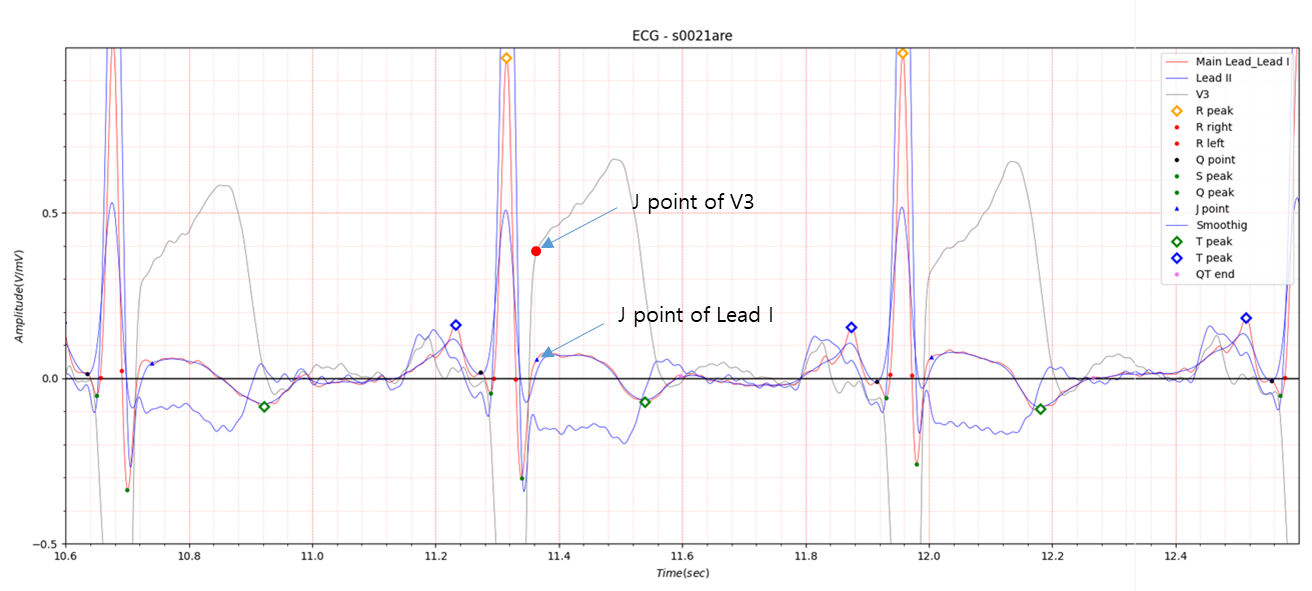
Fig.2 J point of V3 and Lead I
The ST elevation is more pronounced in V3, above 0.3, but Lead I also shows an ST elevation of around 0.05.
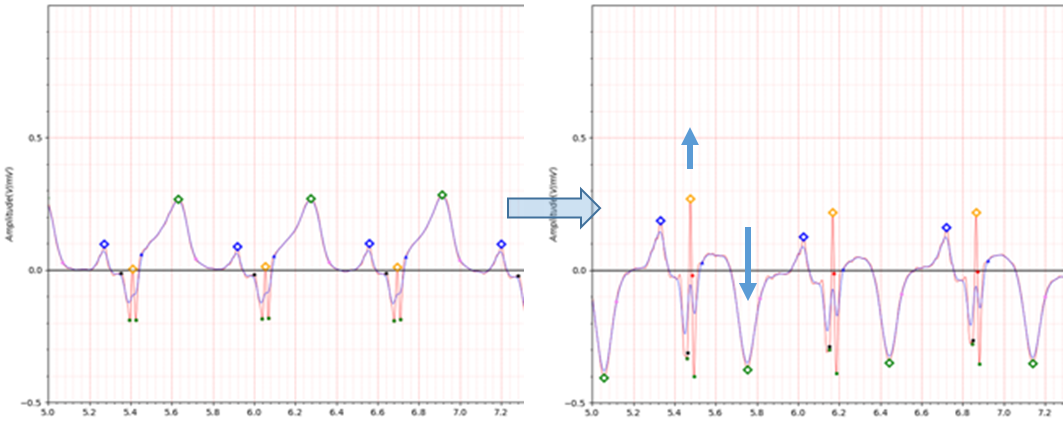
Fig.3 s0036lre
- age: 46
- sex: male
- ECG date: 06/11/1990
- Reason for admission: Myocardial infarction
- Acute infarction (localization): anterior
- Former infarction (localization): no
- Additional diagnoses: Rheumatoid arthritis,Hyperlipoproteinemia Type IV
- Infarction date (acute): 01-Nov-90
For the s0036lre data, the Infarction date: 01-Nov-90 and ECG date: 06/11/1990 are 5 days apart.
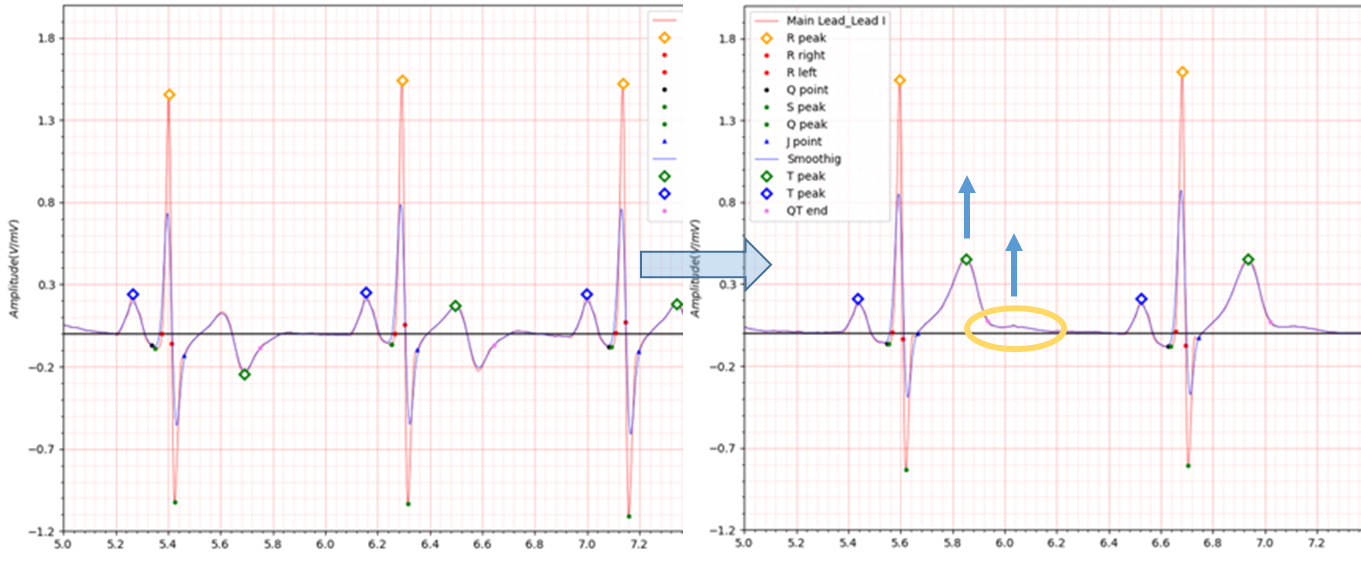
Fig.4 s0268lre -> s0290lre
The biphasic T wave morphology of s0268lre turned positive during MI recovery, but left a scar from the MI, as shown by the yellow border in Fig.4.

Fig.5 https://ecg.utah.edu/lesson/9
1. Normal ECG prior to MI
2. Hyperacute T wave changes - increased T wave amplitude and width; may also see ST elevation
3. Marked ST elevation with hyperacute T wave changes (transmural injury)
4. Pathologic Q waves, less ST elevation, terminal T wave inversion (necrosis)
(Pathologic Q waves are usually defined as duration ≥ 0.04 s or ≥ 25% of R-wave amplitude)
5. Pathologic Q waves, T wave inversion (necrosis and fibrosis)
6. Pathologic Q waves, upright T waves (fibrosis)
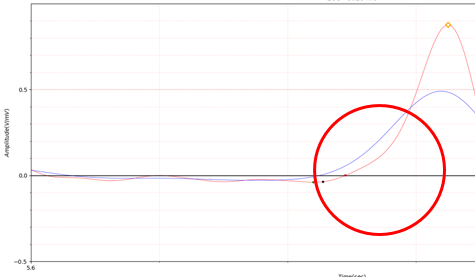
Fig.6 Delta wave
2. antero-lateral
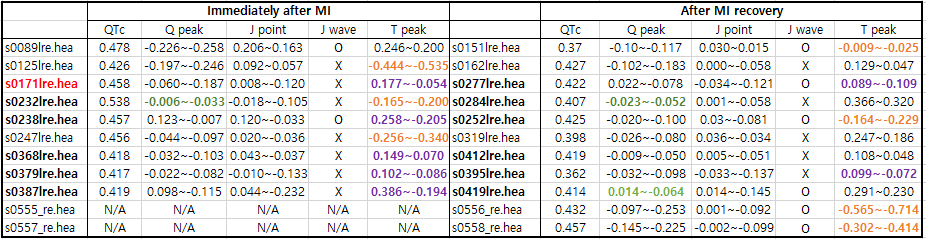
Table2 antereo-lateral
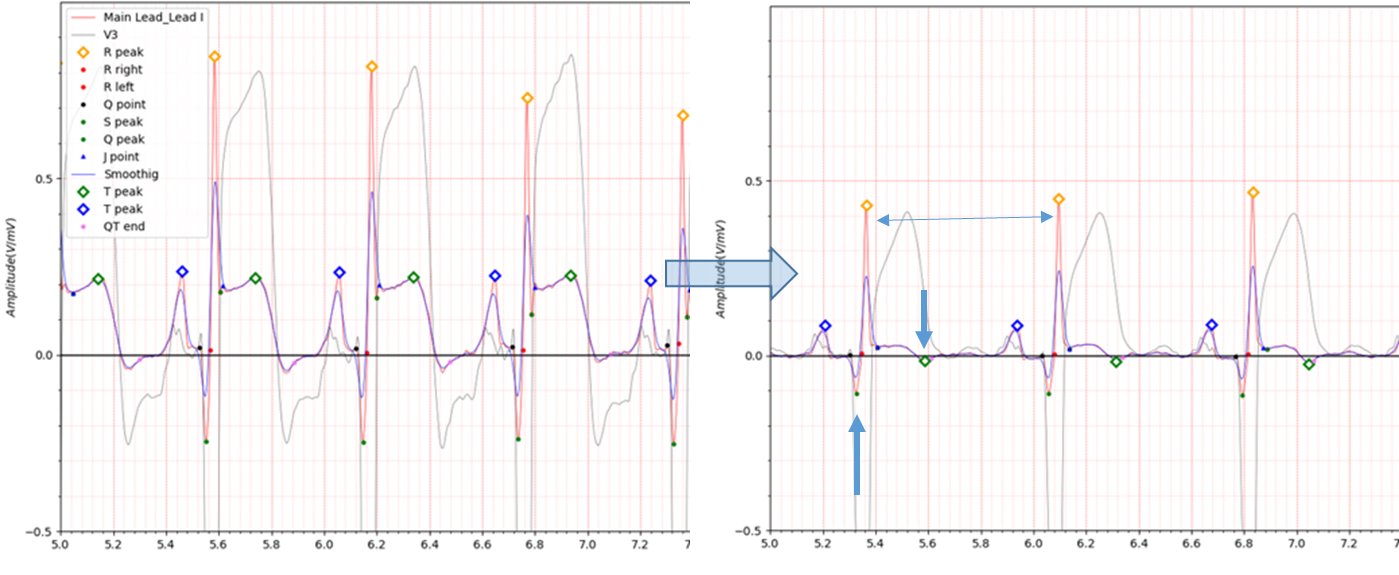
Fig.7 s0089lre -> s0151lre
Fig.7 s0089 electrocardiogram shows a fairly high ST elevation in Lead I.
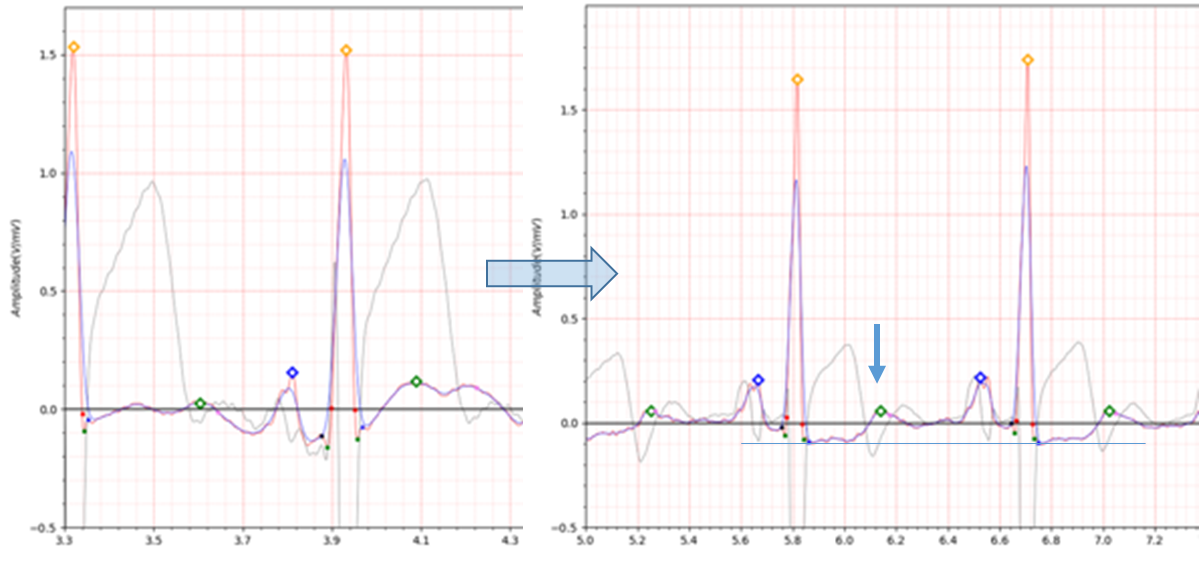
Fig.8 s0171lre -> s0277lre
3. antero-septal
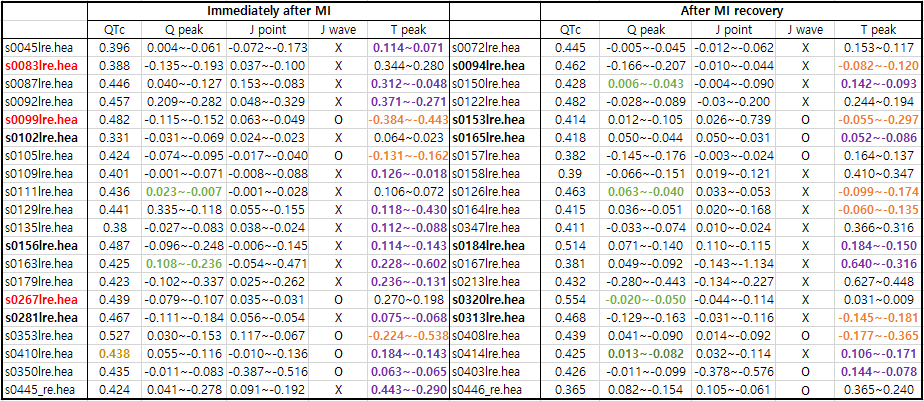
Table3. antero-septal
Note:
Former infarction: s0156lre(anterior),s0281lre(antero-lateral), s0350lre(inferior (1+2))
For antero-septo-lateral, I did not separate it into a separate category because there is only one data point.

Table4. antero-septo-lateral
Note:
Former infarction: s0294lre(anterior)
In the case of s0350lre, it shows a fairly deep J point value.
I introduced Bundle Branch Block in the previous post 'Detect Bundle Branch Block using Phase space'.
S350lre is BBB-like, but not BBB.
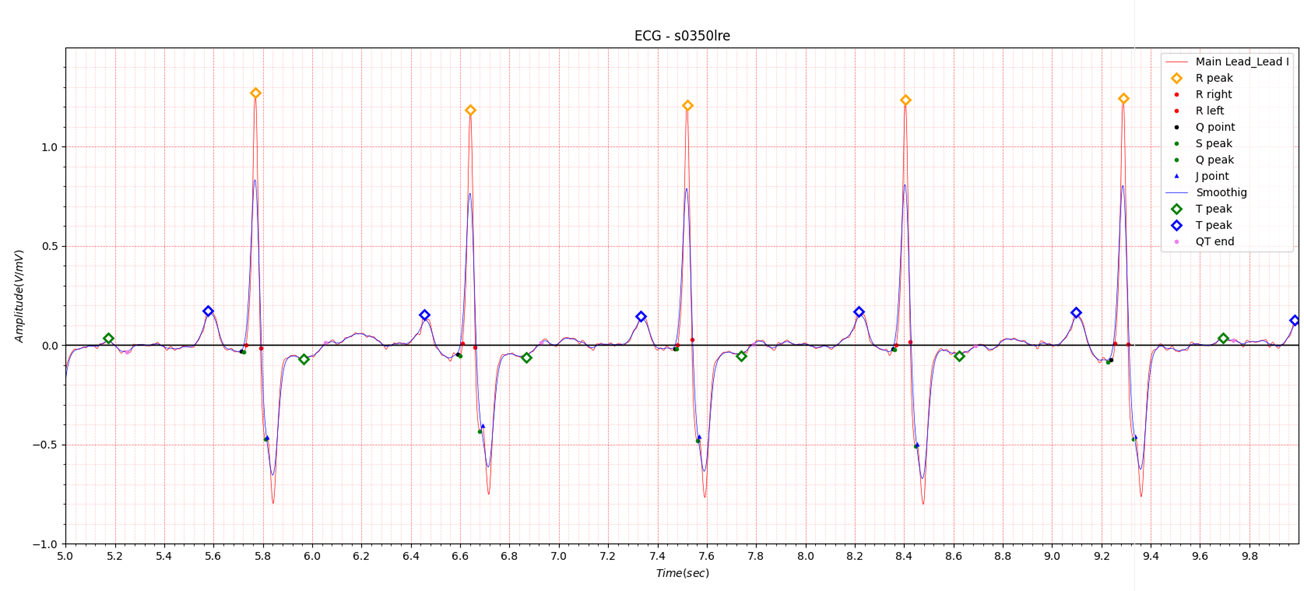
Fig.9 s0350lre deep J point not BBB