Projects ECG (Electrocardiogram) Monitoring
QT Interval III
In my previous post, QT interval II, I introduced the results of calculating the QT interval for Lead I, Lead II and Lead III. In this post, I introduce the results of changing the structure of the ECG diagnosis software to measure all 12 leads. The main purpose of this post is to check how much the QT interval of Lead I, which can most easily measure ECG using a smartwatch, differs compared to the multi-lead ECG diagnosis system.
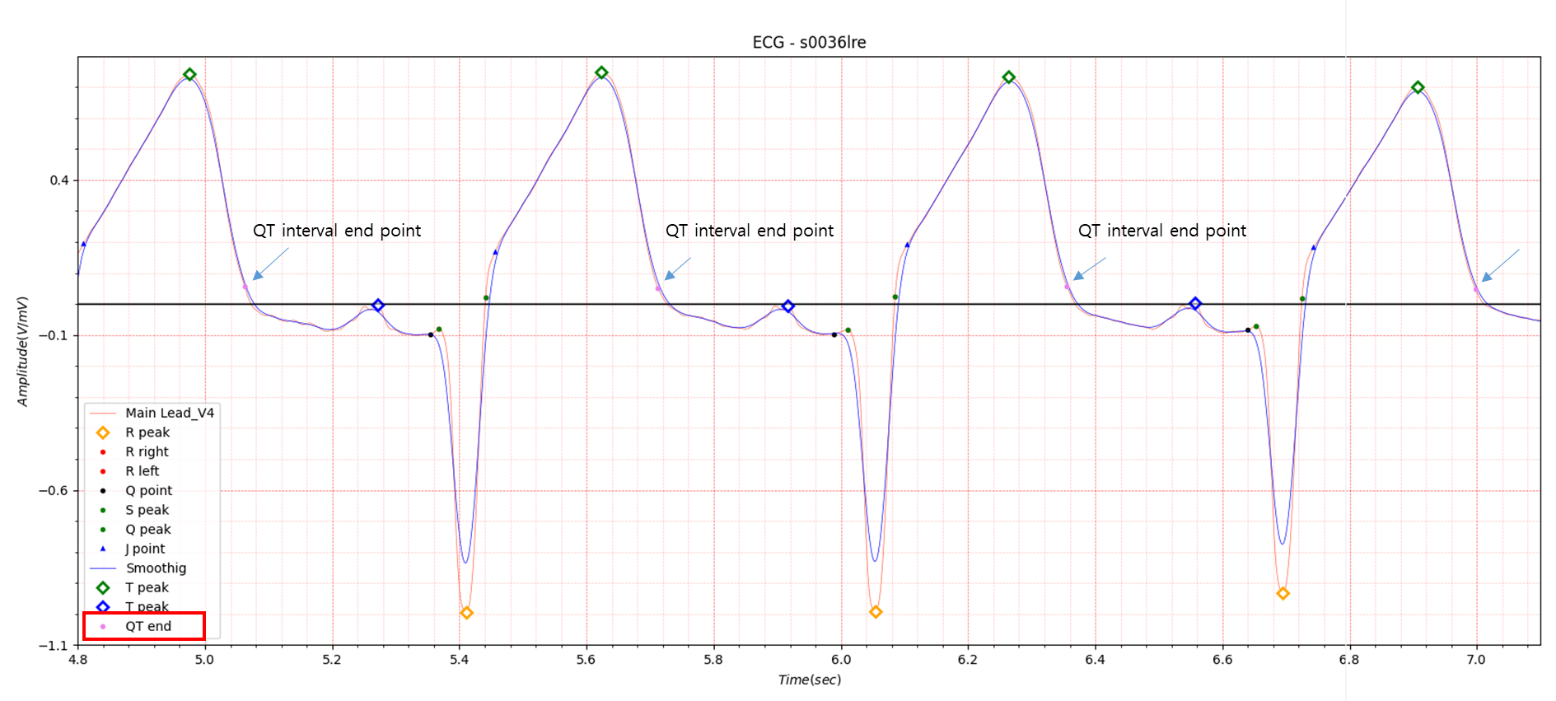
Fig.1 Lead v4
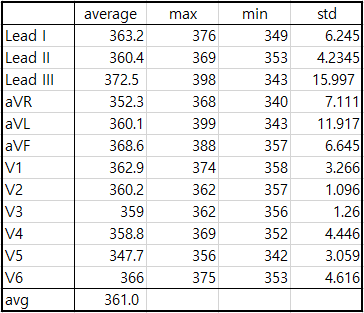
Table1. 12 Lead QT interval of s0036lre
The QT interval of Lead III in QT interval II was 361.3 (avg), 398 (max), 318 (min), and 20.868 (std), but the standard
deviation decreased slightly during the correction work. The difference between the average value of 12 Leads of
s0036lre and the QT interval value of Lead I was about 3ms.
I have absolutely no idea how the ECG diagnostic system widely used in hospitals processes the QTc calculation results.
I think this part will be decided through consultation with companies that want to collaborate with AVISS.
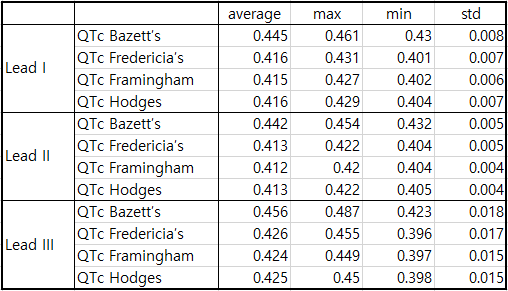
Table2. QTc of s0036lre
The standards for Prolonged QT interval introduced in QT interval are listed again as follows.
For adult males:
Normal QT interval: 0.35-0.43 seconds
Borderline QT interval: 0.43-0.45 seconds
Prolonged QT interval: More than 0.45 seconds
For adult females:
Normal QT interval: 0.35-0.45 seconds
Borderline QT interval: 0.45-0.47 seconds
Prolonged QT interval: More than 0.47 seconds
According to the results of Bazett’s QTc, which is the most widely used, Prolonged QT interval is shown in Lead III and
Borderline QT interval is shown in Lead I, aVF in Table 1 also indicates Prolonged QT interval.
The diagnosis results of the s0036lre data in the PTB database are as follows.
- age: 46
- sex: male
- Reason for admission: Myocardial infarction
- Acute infarction (localization): anterior
- Former infarction (localization): no
- Additional diagnoses: Rheumatoid arthritis, Hyperlipoproteinemia Type IV
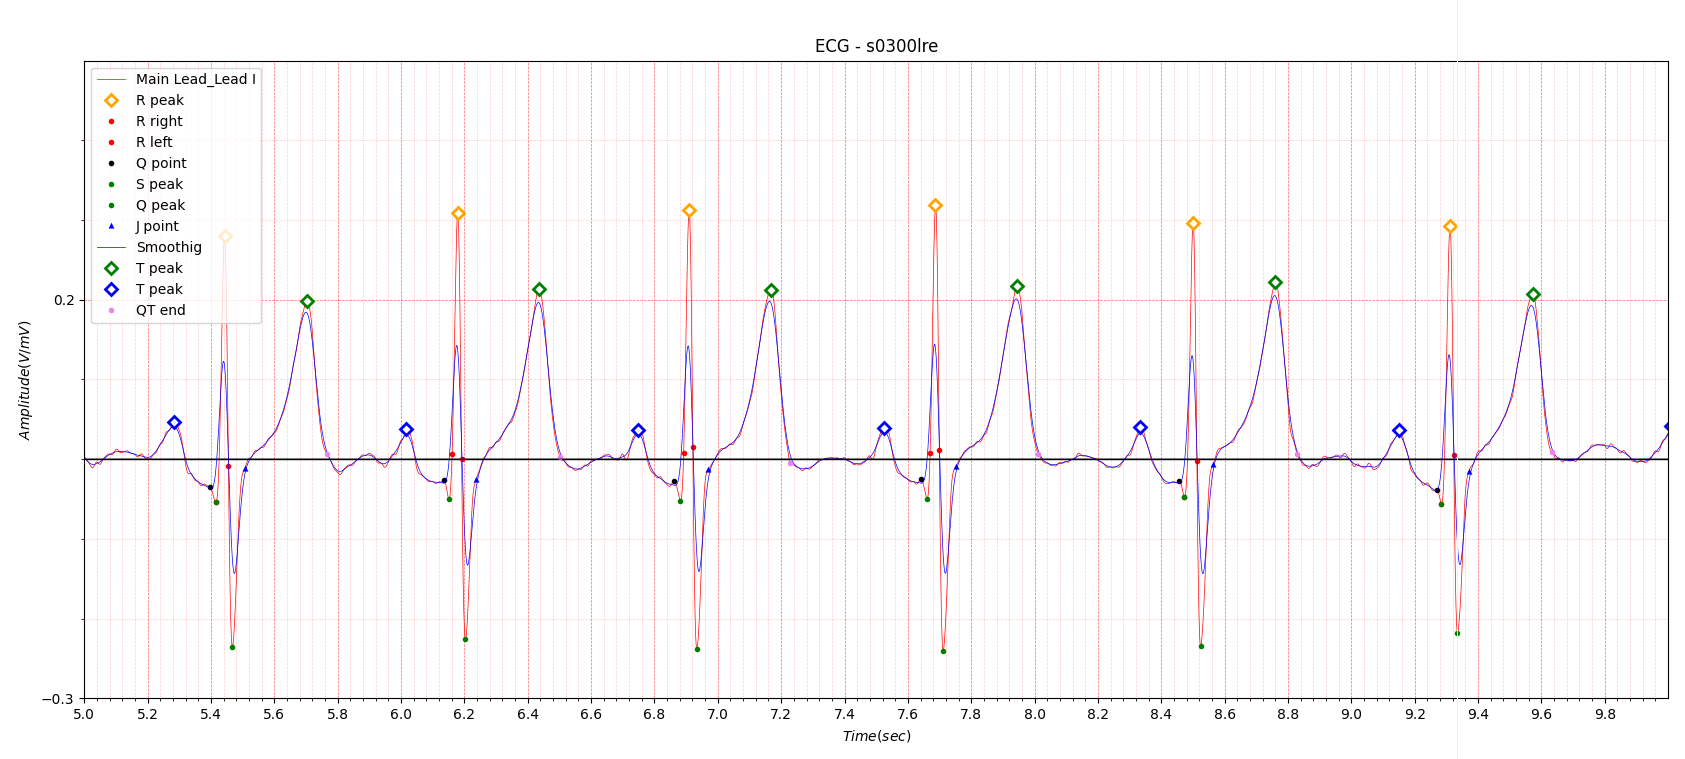
Fig.2 s0300lre
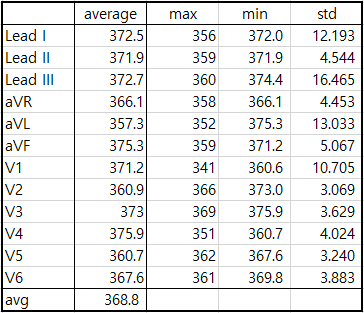
Table 3. s0300lre
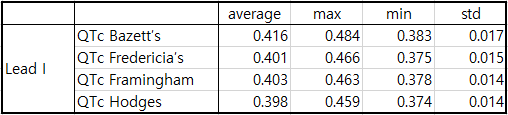
Table4. QTc of s0300lre/p>
Fig. 2 shows a normal electrocardiogram.
The QT interval of s0300lre is summarized in Table 3. The difference between the average QT interval of Lead 12 and Lead
I was approximately 4ms.
Table 4 shows the QTc values of Lead I.
Since the difference between the maximum and minimum QT interval values of the 12 leads was not large, only the
results of Lead I were shown.
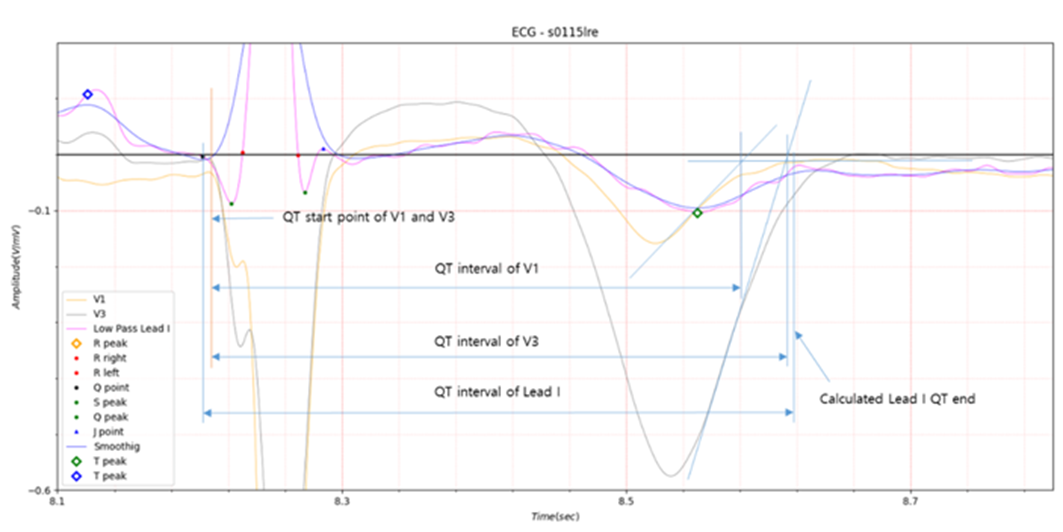
Fig.3 s0115lre
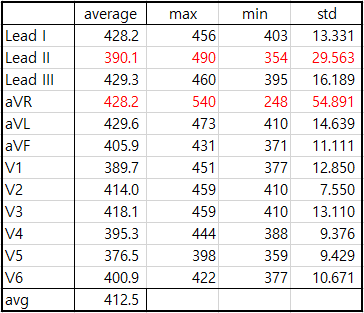
Table5. QT interval of s0115lre
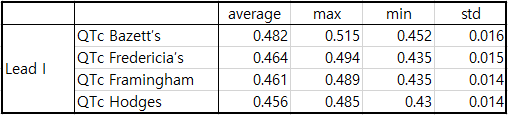
Table6. QTc of s0115lre
s0115lre in Fig. 3 introduced that there may be a problem with the QT interval end point obtained by the intersection of
T wave maximum slope with the isoelectric line in the QT interval.
In Table 5, Lead II and aVR had very large standard deviations. In particular, aVR with a large standard deviation is
shown in Fig. 5. The average value in Table 5 is the result obtained by excluding Lead II and aVR with standard
deviations exceeding 20. The difference between the average QT interval of Lead 12 and Lead I was approximately 16ms.
The diagnosis results of the s0115lre data in the PTB database are as follows.
- age: 49
- sex: male
- Reason for admission: Myocardial infarction
- Acute infarction (localization): antero-septal
- Former infarction (localization): no
- Additional diagnoses: Arterial Hypertension
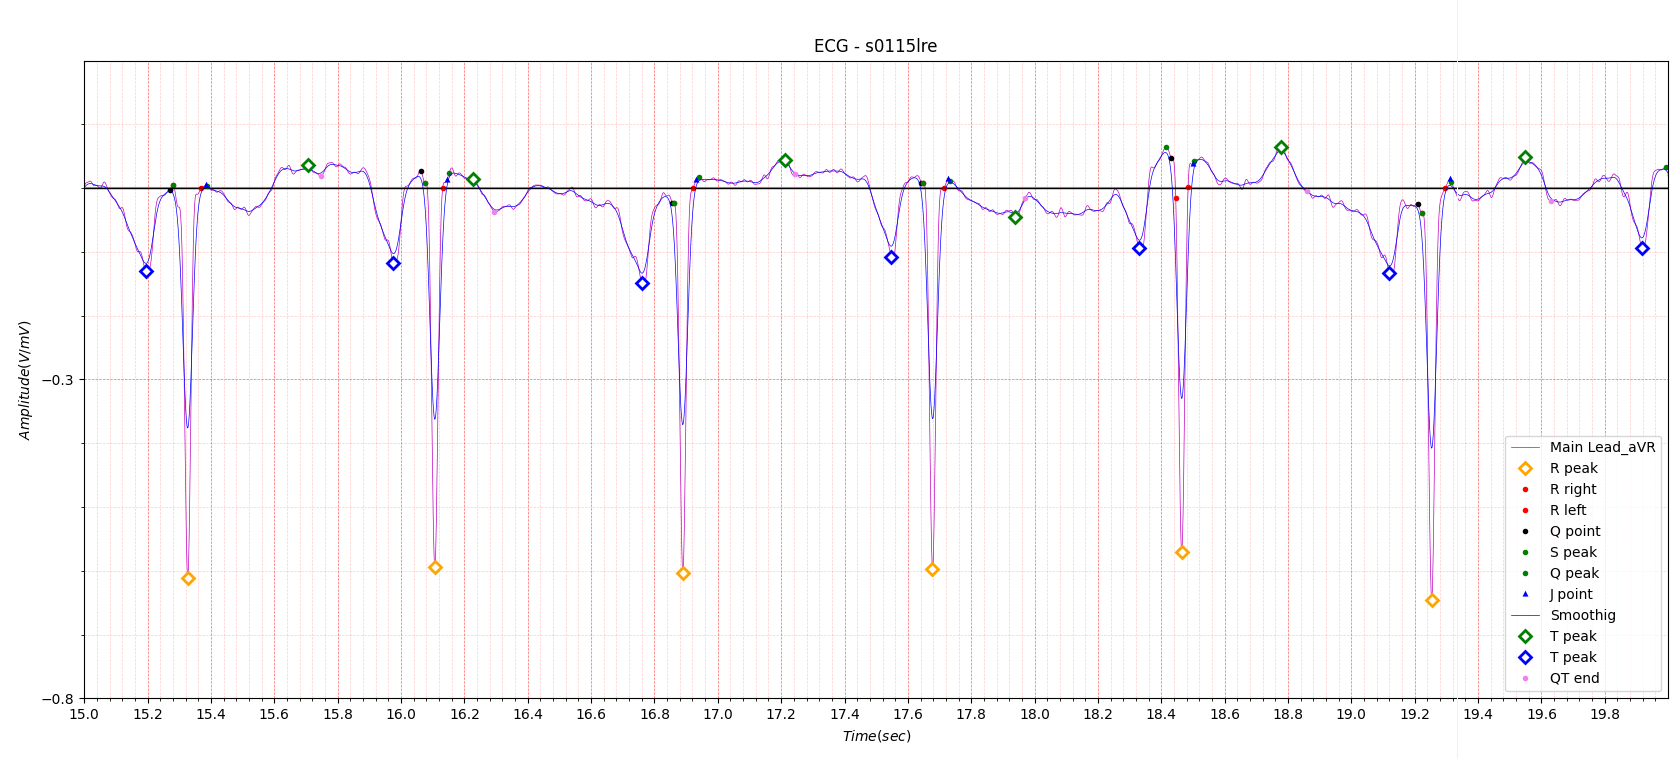
Fig.4 aVR of s0115lre
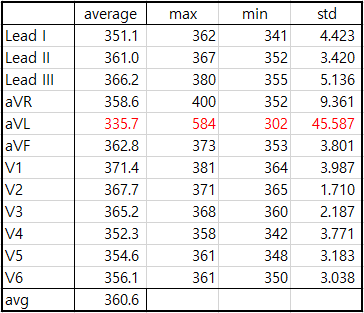
Table7. QT interval of s0552_re
The QT interval of s0552_re data is summarized in Table 7.
The average value in Table 7 is the result excluding aVL with a large standard deviation.
Fig.5 shows the aVL electrocardiogram with a large standard deviation.
Fig.4 and 5, where the standard deviation is large, show a very low T wave value of about 0.05.
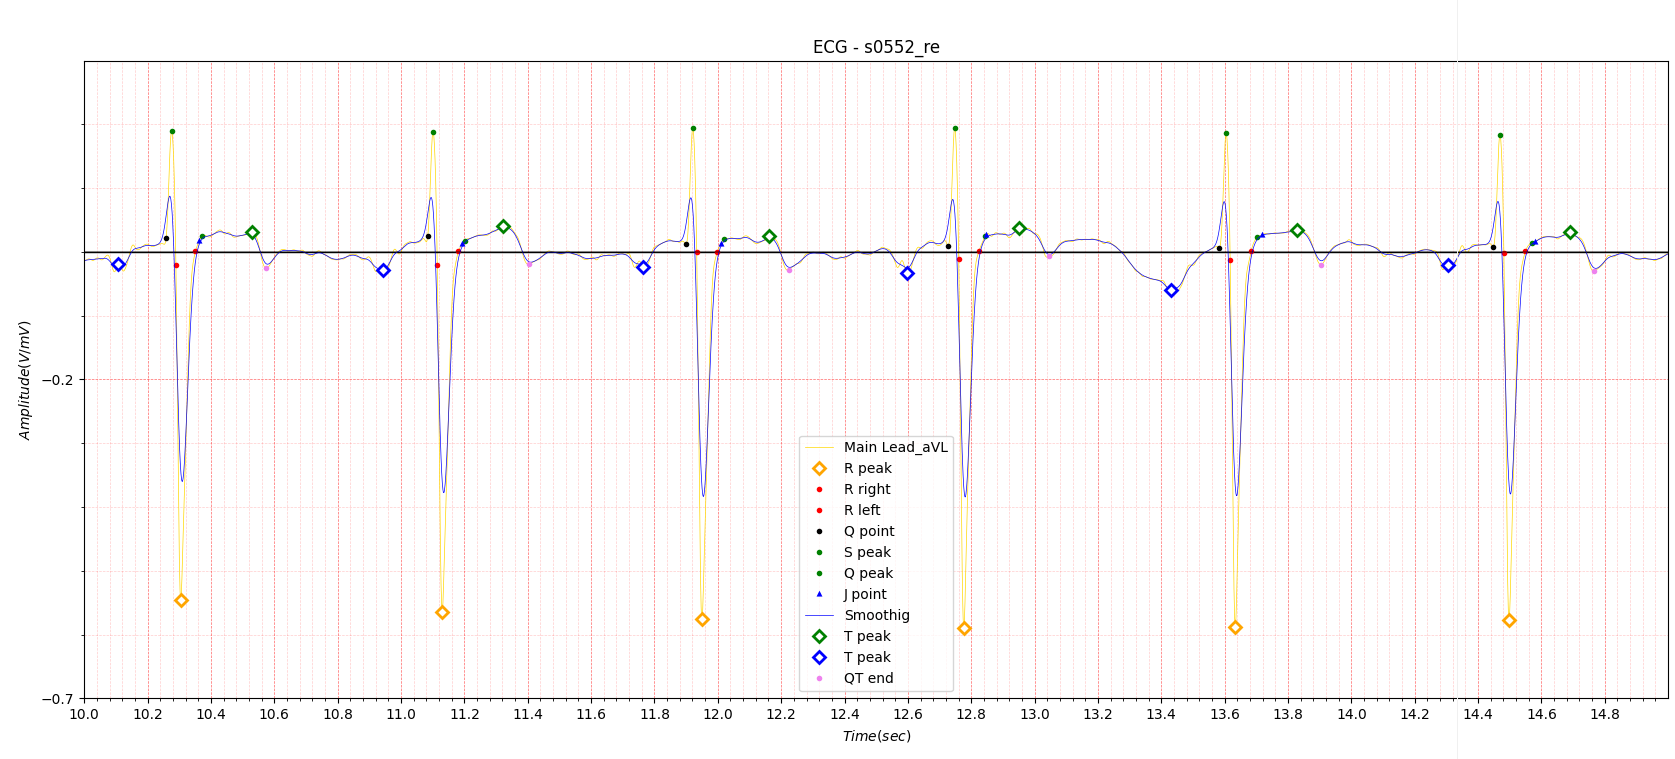
Fig.5 aVL of s0552_re
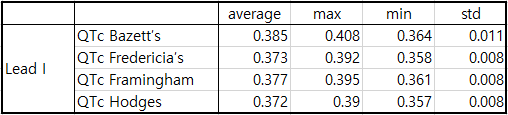
Table8. QTc of s0552_re
In the previous post, Phase space in ECG, I introduced a method of measuring the Q point, the QT interval start point,
using phase space with greater reliability than any other method introduced so far.
The result of calculating the QT interval end point using phase space also showed more reliable results than the QT
interval end point obtained by the intersection of T wave maximum slope with the isoelectric line.
Although I am confident that the QT interval obtained using phase space shows highly reliable results, there is no
conditions for direct comparison with the commercially available 12-lead electrocardiogram diagnostic system. If anyone
is reading this and wants to write a paper on the QT interval measurement method using phase space, I will fully
cooperate.