Projects ECG (Electrocardiogram) Monitoring
Myocardial infarction V
In this post, I have summarized the main factors related to MI related to inferior and lateral.
1. inferior
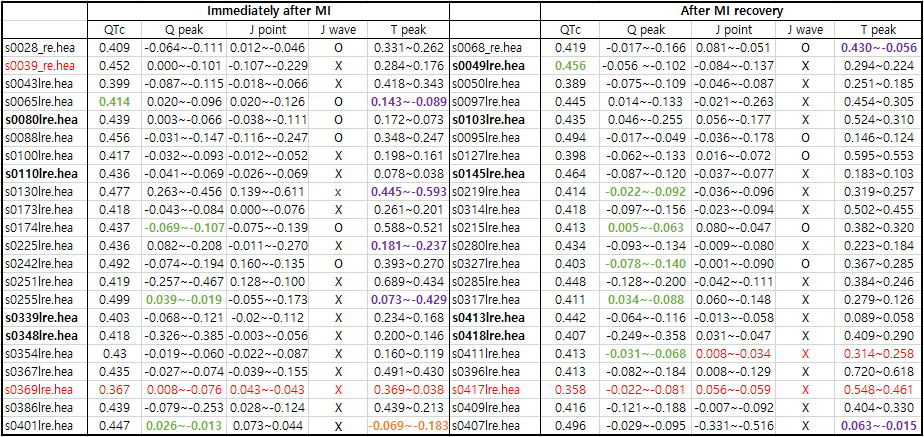
Table 1. inferior
Note:
Former infarction: s0043lre(inferior),s0065lre(inferior),
Data name: red color Myocardial infarction II or
Myocardial infarction III introduced
Q peak: green color Delta wave
T peak: purple color T wave positive or negative
orange color
T wave reversed
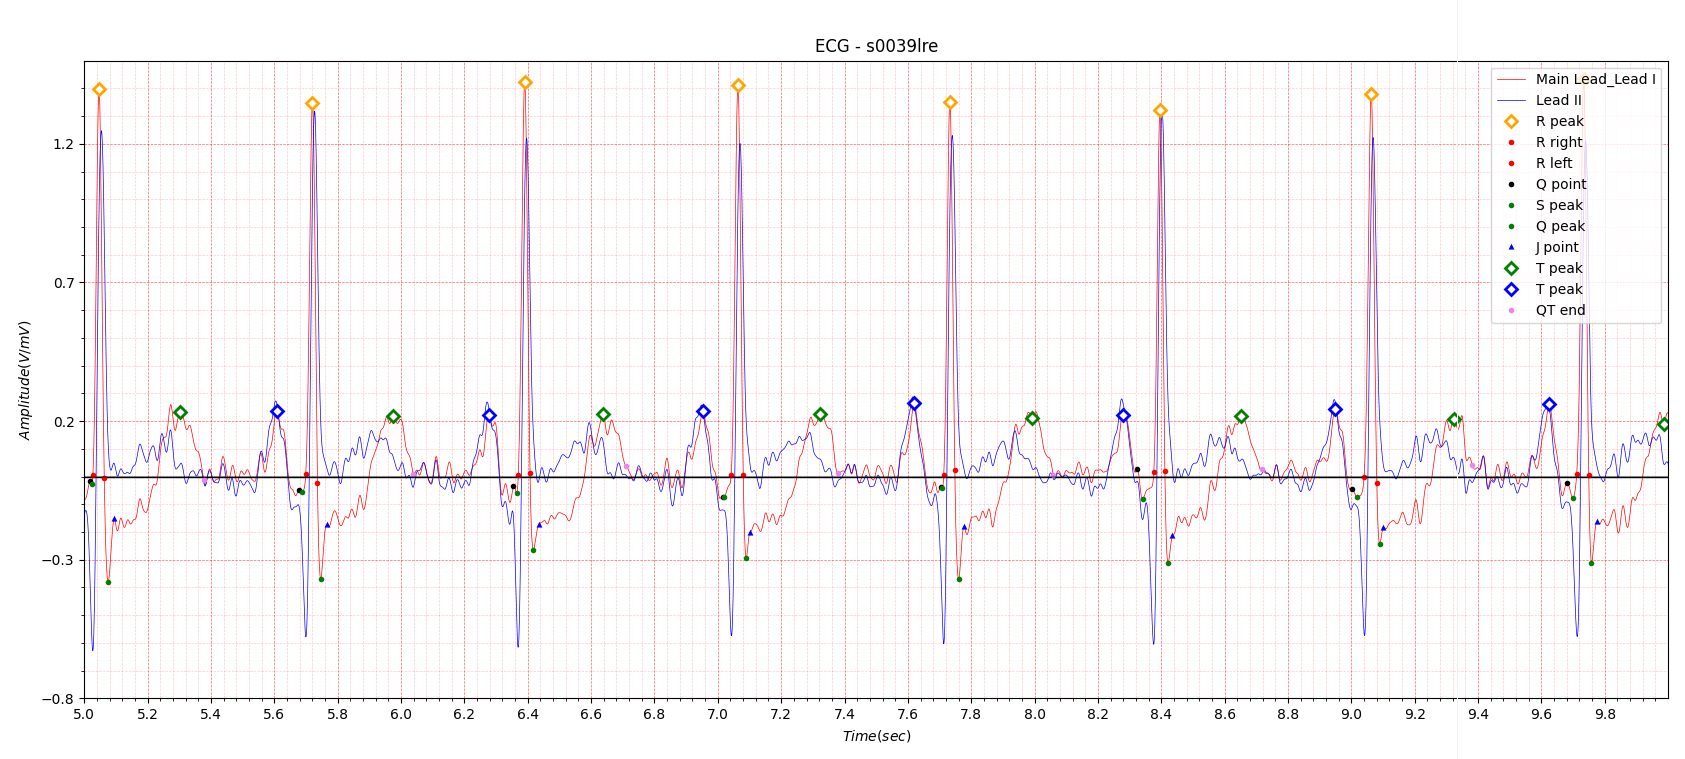
Fig.1 s0039lre
Generally, inferior MI has a deep Q wave in Lead II, as shown in Fig.1.
It is commonly said that the Q wave peak is a scar left by MI.
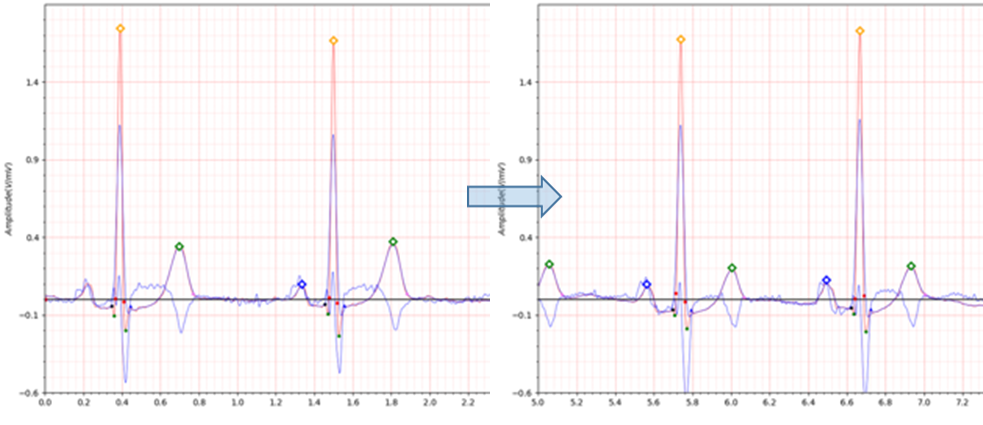
Fig.2 patient012 s0043 -> s0050
-
ECG date: 12/11/1990
- Infarction date (acute): 09-Nov-90
- Previous infarction (1) date: 01-Jan-83
- Reason for admission: Myocardial infarction
- Acute infarction (localization): inferior
- Former infarction (localization): inferior
- Additional diagnoses: Renal insufficiency
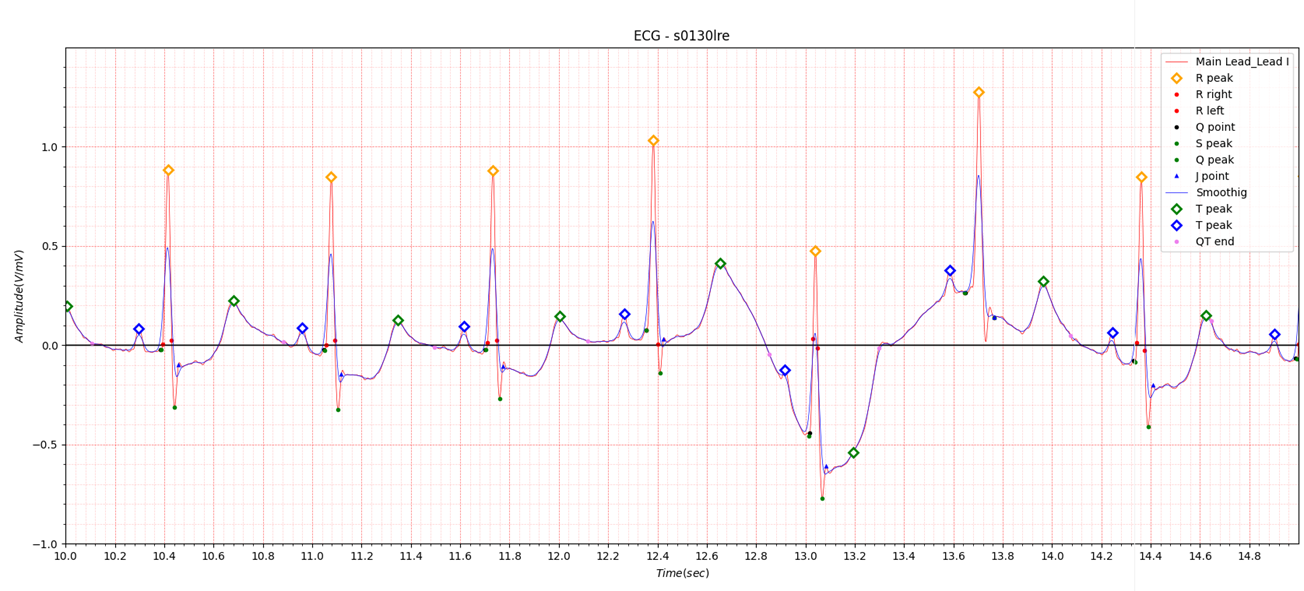
Fig.3 s0130lre
If you look closely at the table summarizing the major factors related to MI, you will see factors that have changed
significantly.
As shown in Fig.3, it is often observed that each wave fluctuates greatly when MI occurs.
2. Infero-lateral
There is only one MI data related to lateral in the PTB database. The infero-lateral will contain lateral MI features.
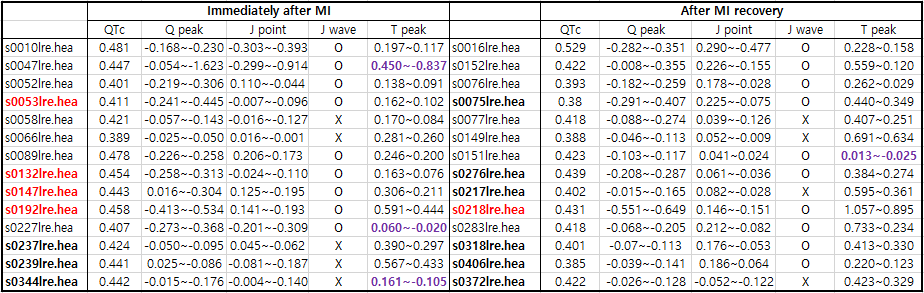
Table2. infero-lateral
Note:
Former infarction: s0132lre(postero-lateral)
Data name: red color Myocardial infarction II or
Myocardial infarction III introduced(s0218lre: 0.416 -> 0.431)
Q peak: green color Delta wave
T peak: purple color T wave positive or negative
orange color
T wave reversed
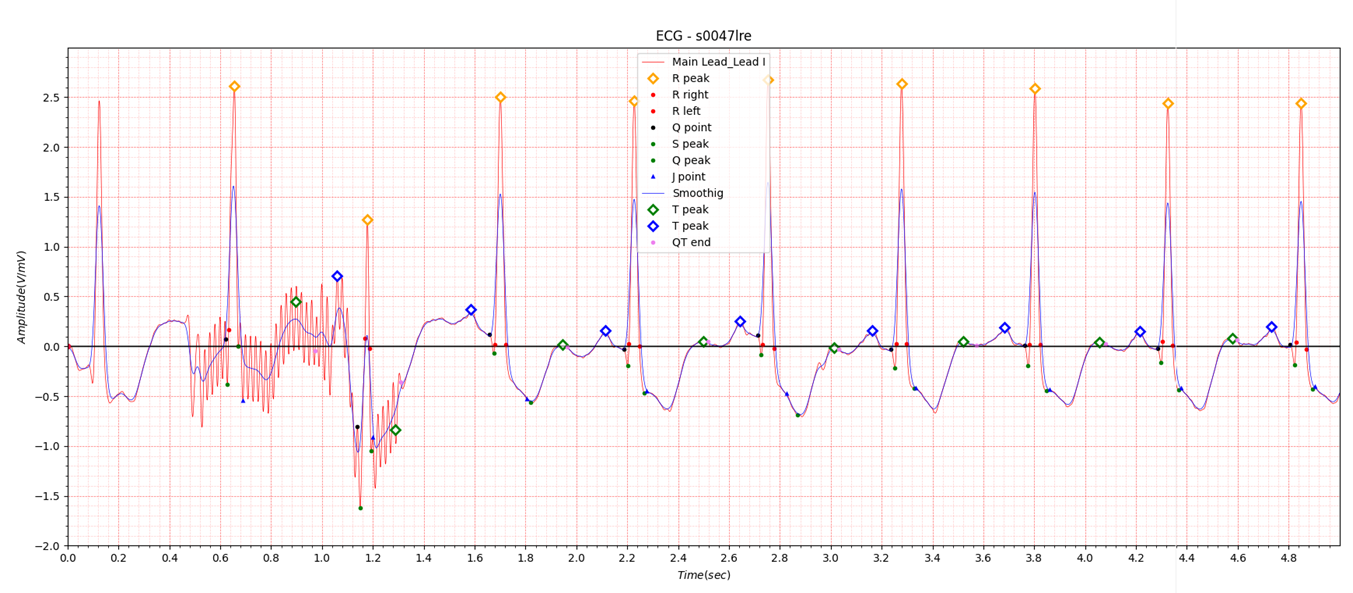
Fig.4 s0047lre
The S0047lre data also has large fluctuations like the s0130lre data in Fig.3. The reason why the s0555_re and s0557_re tables were marked as N/A in the last post was because it was difficult to process when severe noise occurred locally as shown in Fig.4. Since it is difficult to obtain digital data when MI occurs, I tried to preserve the data as much as possible when such cases occur.
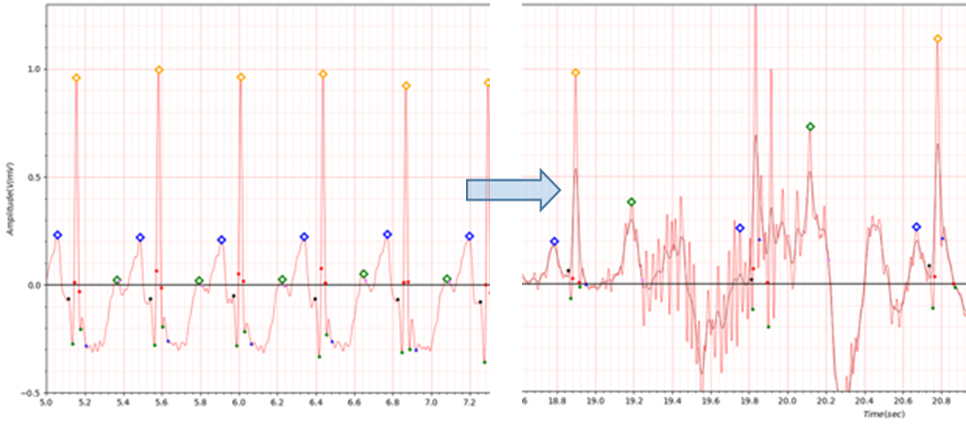
Fig.5 s0227lre -> s0283lre
For s0283lre in Table2, the noise effect as shown in Fig.5 must be considered.
S0227 has a heart rate of over 140. In cases with such a high heart rate, it is thought that there is a problem with the
existing QTc calculation method.
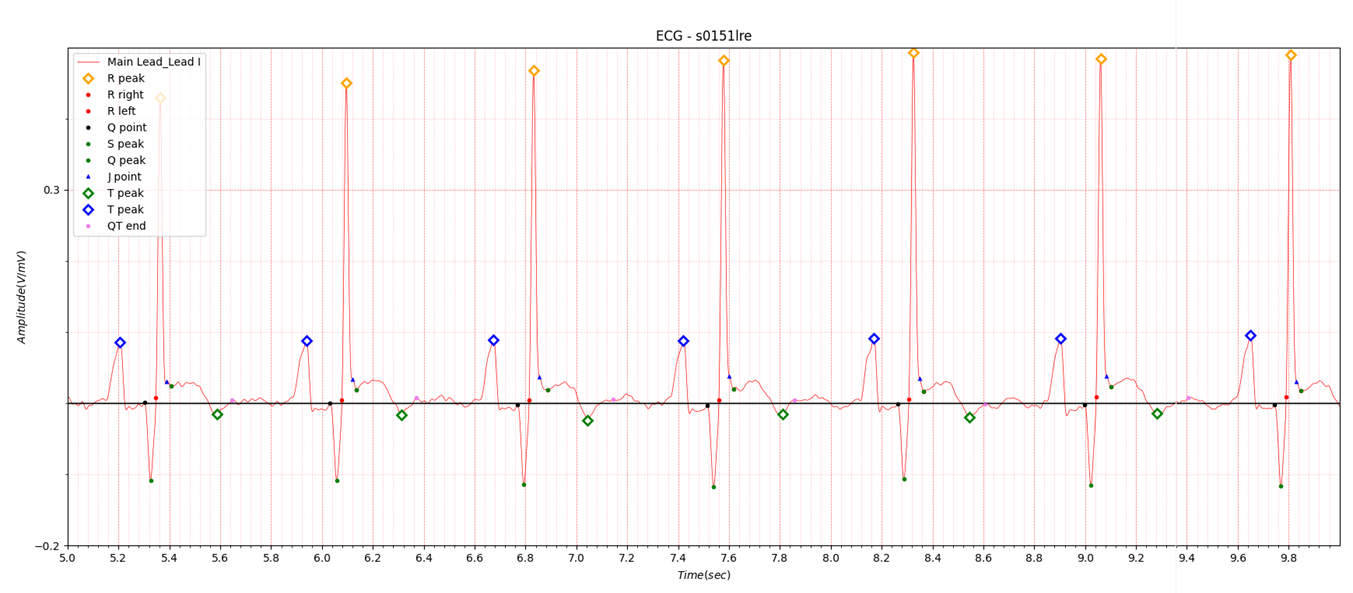
Fig.6 s0151
In Fig.6, the J wave was observed. The J point related code is still difficult to determine in the classic definition of early repolarization and new definitions of early repolarization in the previous post QRS complex J point, so there are some differences depending on the boundary conditions. The T peak location in Figure 6 was determined for the convenience of QTc calculation.
3. infero-postero-lateral
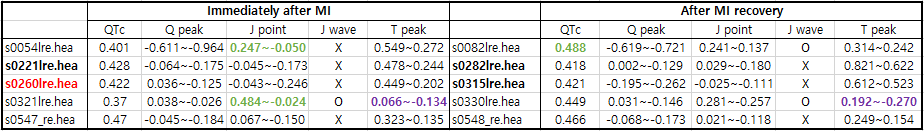
Table3. infero-postero-lateral
Note:
Data name: red color Myocardial infarction II or
Myocardial infarction III introduced
J point: green color: classic definition of early repolarization and new definitions of early repolarization
T peak: purple color T wave positive or negative
orange color
T wave reversed
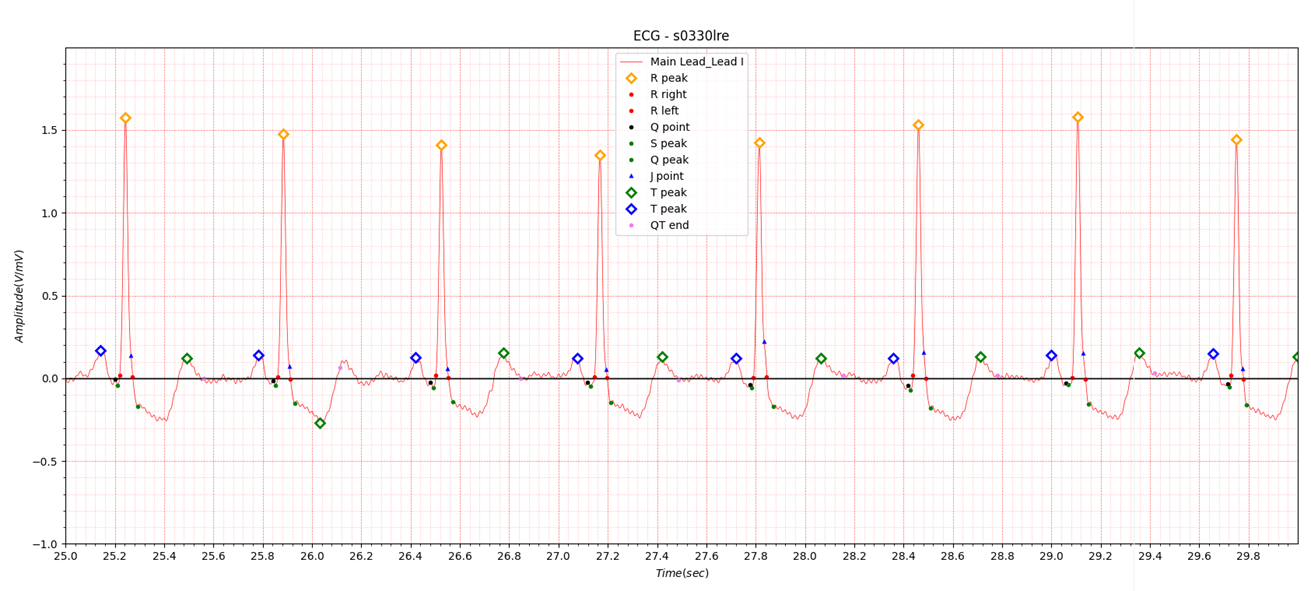
Fig.7 s0330lre
The reason why the T peak in s0330lre in Table 3 is 0.192~-0.270 is shown in Fig.7.
The range was set so that the location of the T peak was not too close to the J point or S peak. In Fig. 7, the T wave
can be seen as biphasic, but it is difficult to set because the ratio of negative peak and positive peak is sometimes
irregular.
4. lateral
This is the data introduced in the previous post.
Table4. lateral
5. postero-lateral

Table5. postero-lateral
Note:
Data name: red color Myocardial infarction II or
Myocardial infarction III introduced
T peak: purple color T wave positive or negative
orange color
T wave reversed
s0269 QTc 0.475 -> 0.323
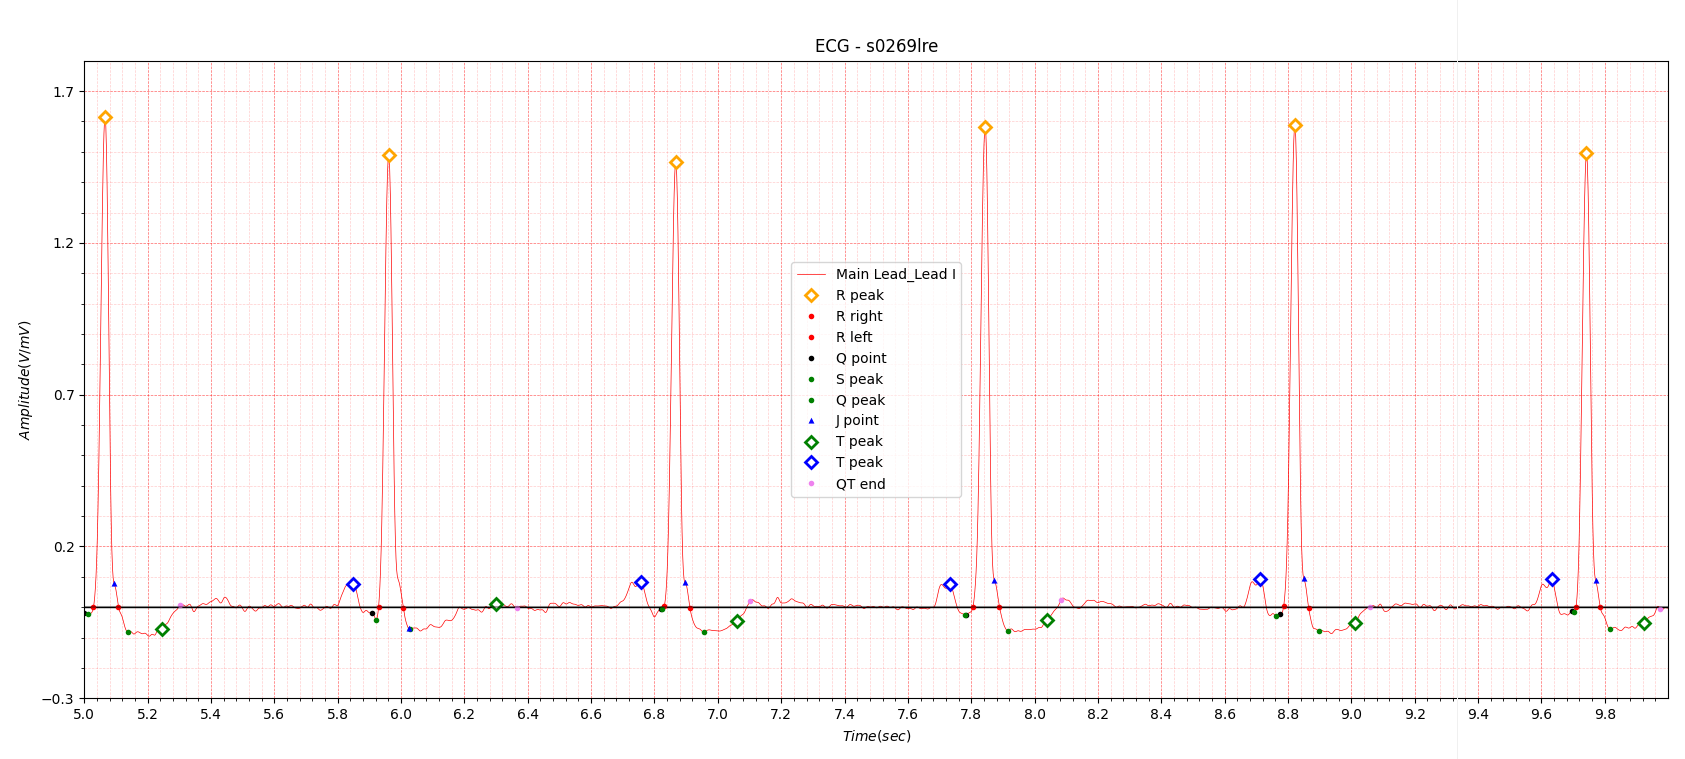
Fig.8 s0269lre
In Figure 8, the T wave positive peak is unclear. The T wave negative peak is also not within the specified range. If the T wave is flat, QTc itself is judged to be meaningless.
6. Conclusion of Myocardial infarction
Myocardial infarction may be difficult to distinguish from myocarditis or cardiomyopathy. The purpose of covering MI from Myocardial infarction I to Myocardial infarction V is not intended to diagnose MI.I wanted to focus on finding out the difference between before and after MI and informing of the risk of MI in advance through continuous monitoring, but it was difficult to obtain MI digital electrocardiogram before MI.
This is a task that must be solved through collaboration with organizations that have accumulated related data. I attempted to determine whether patients who had experienced MI could be identified in a single-lead ECG measurement environment using ECG data from the PTB database immediately after MI and after MI recovery. This is because I wanted to avoid the error of making a diagnosis of MI when a patient who has already experienced MI undergoes ECG monitoring to prevent recurrence.
Here's what I was able to find out through several cases of MI:
- T wave flat
- T wave negative
- Q peak is below -0.1 or exceeds J point -0.05~0.05 range
If accumulated information on P, Q, R, S and T waves is stored through long-term continuous electrocardiogram monitoring, angina pectoris or MI can be sufficiently prevented in advance.
Reference
https://www.msdmanuals.com/professional/cardiovascular-disorders/coronary-artery-disease/acute-myocardial-infarction-miAcute myocardial infarction is myocardial necrosis resulting from acute obstruction of a coronary artery. Symptoms include chest discomfort with or without dyspnea, nausea, and/or diaphoresis. Diagnosis is by electrocardiography (ECG) and the presence or absence of biomarkers. Treatment is with antiplatelets, anticoagulants, nitrates, beta-blockers, statins, and reperfusion therapy. For ST-segment-elevation myocardial infarction, emergency reperfusion is via fibrinolytic drugs, percutaneous intervention, or, occasionally, coronary artery bypass graft
In the United States, up to 1.0 million myocardial infarctions occur annually. Myocardial infarction (MI) results in death for 300,000 to 400,000 people (see also Cardiac Arrest).
Acute MI, along with unstable angina, is considered an acute coronary syndrome. Acute MI includes both non–ST-segment elevation myocardial infarction (NSTEMI) and ST-segment elevation myocardial infarction (STEMI). Distinction between NSTEMI and STEMI is vital as treatment strategies are different for these two entities.
Pathophysiology of Acute MI
Myocardial infarction is defined as myocardial necrosis in a clinical setting consistent with myocardial ischemia (1). These conditions can be satisfied by a rise of cardiac biomarkers (preferably cardiac troponin [cTn]) above the 99th percentile of the upper reference limit (URL) plus at least one of the following:
- Symptoms of ischemia
- ECG changes indicative of new ischemia (significant ST/T changes or left bundle branch block)
- Development of pathologic Q waves
- Imaging evidence of new loss of myocardium or new regional wall motion abnormality
- Angiography or autopsy evidence of intracoronary thrombus