Projects ECG (Electrocardiogram) Monitoring
T wave axis deviation
T waves are a very important element in the diagnosis of cardiovascular disease.
The reason why P wave was introduced first after the main factors of R wave was because there were many factors to be
considered due to the complexity of T wave. This is because there were ambiguous parts during the simplification
process. In particular, it was difficult to express the T wave morphology in the data structure. In the end, it was
concluded that the easiest way to express T wave morphology is T wave axis deviation.
Generally, T wave axis deviation is obtained using multi-lead, but it can be obtained from single-lead using phase
space. I think that finding the T wave axis angle ultimately has the characteristics of T wave axis deviation.
I will continue to introduce the term T wave axis deviation.
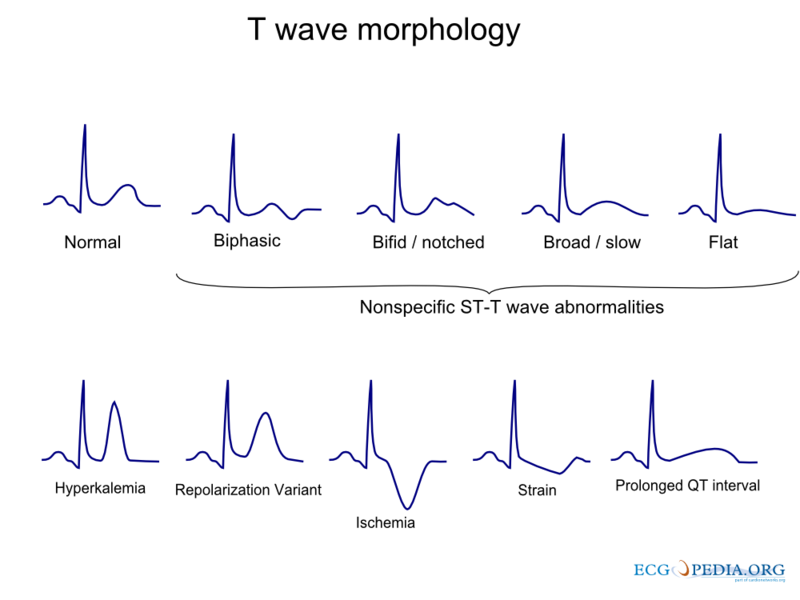
Fig.1 File:T wave morphology.png - ECGpedia
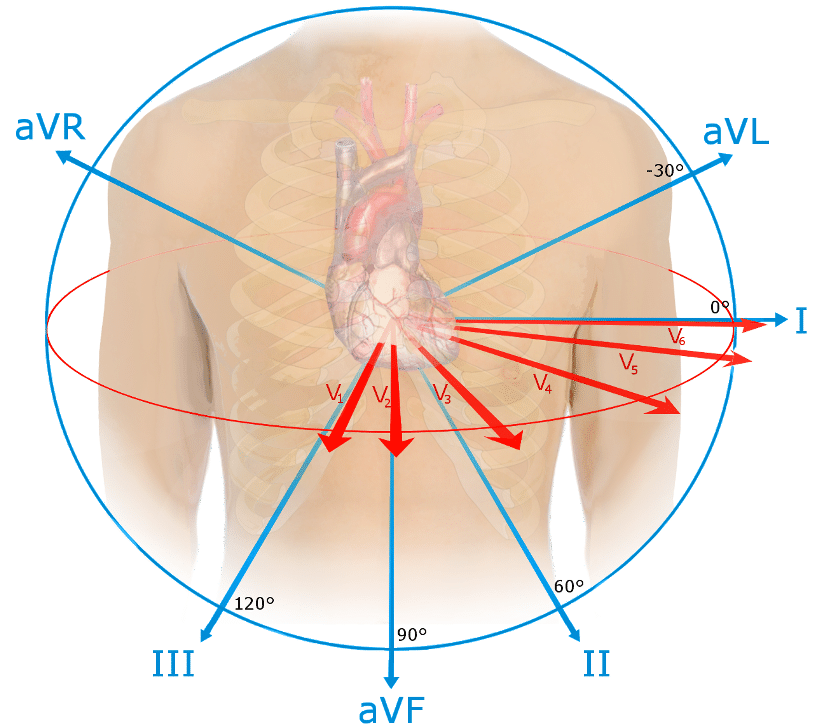
Fig.2 The ECG - Cardiac Cycle - TeachMePhysiology
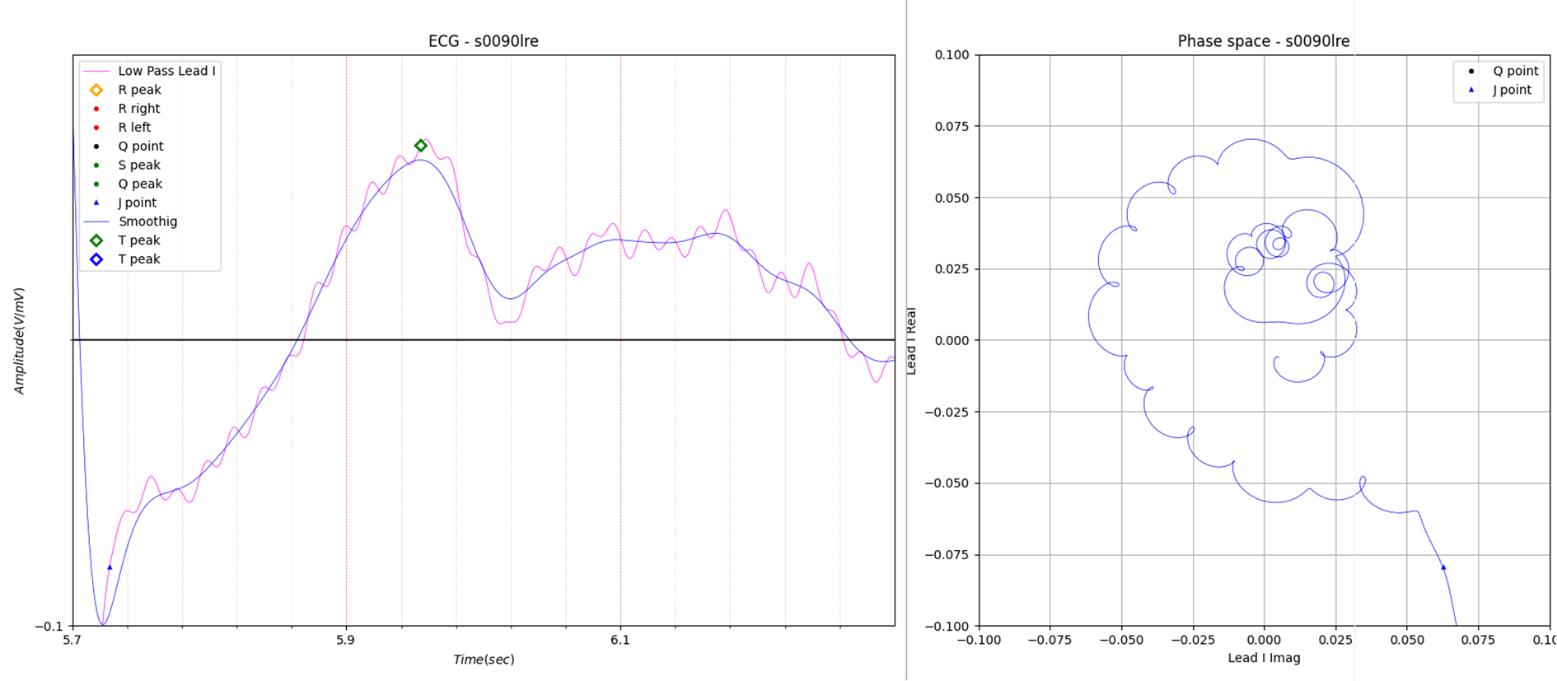
Fig.3 Low amplitude T wave
Generally, when the amplitude of the T wave is lowered to 0.1 mV, a slight tremor occurs, as if the heart muscle is convulsing. This slight tremor is a major obstacle to extracting important parameters of the T wave. When analyzing the electrocardiogram, I use the right phase space instead of the left graph electrocardiogram in Fig.3. However, the phase space of Fig.3 was so complex that it was almost impossible to use, so it could not be used for analysis.
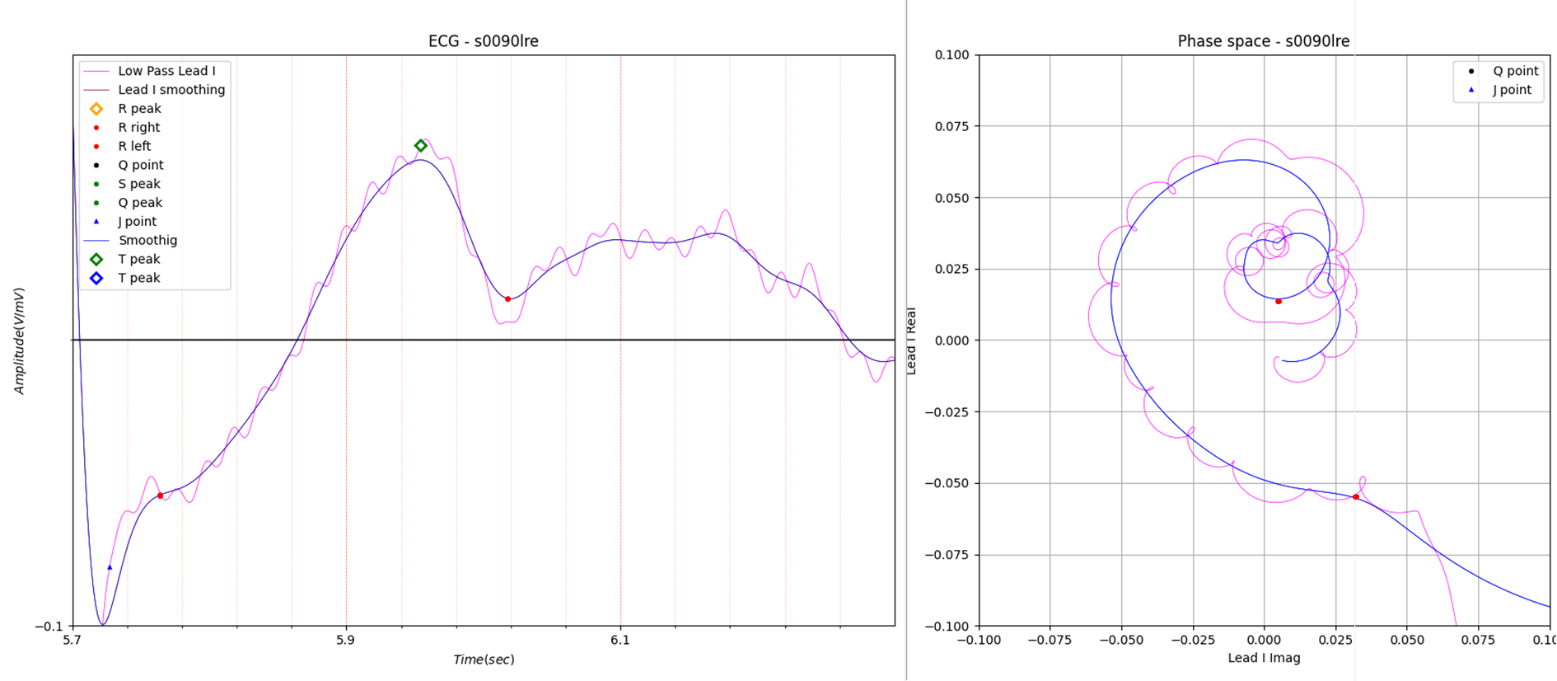
Fig.4 Smoothed phase space
The very complex phase space in Fig.3 has been greatly simplified as shown in Fig.4 by using the data smooth function,
making it easier to analyze.
Now I will explain how to calculate T wave axis deviation using three cases as examples.
I have applied for a patent for two methods for calculating the axis deviation of P, R and T waves, but I have not
introduced one of them yet.
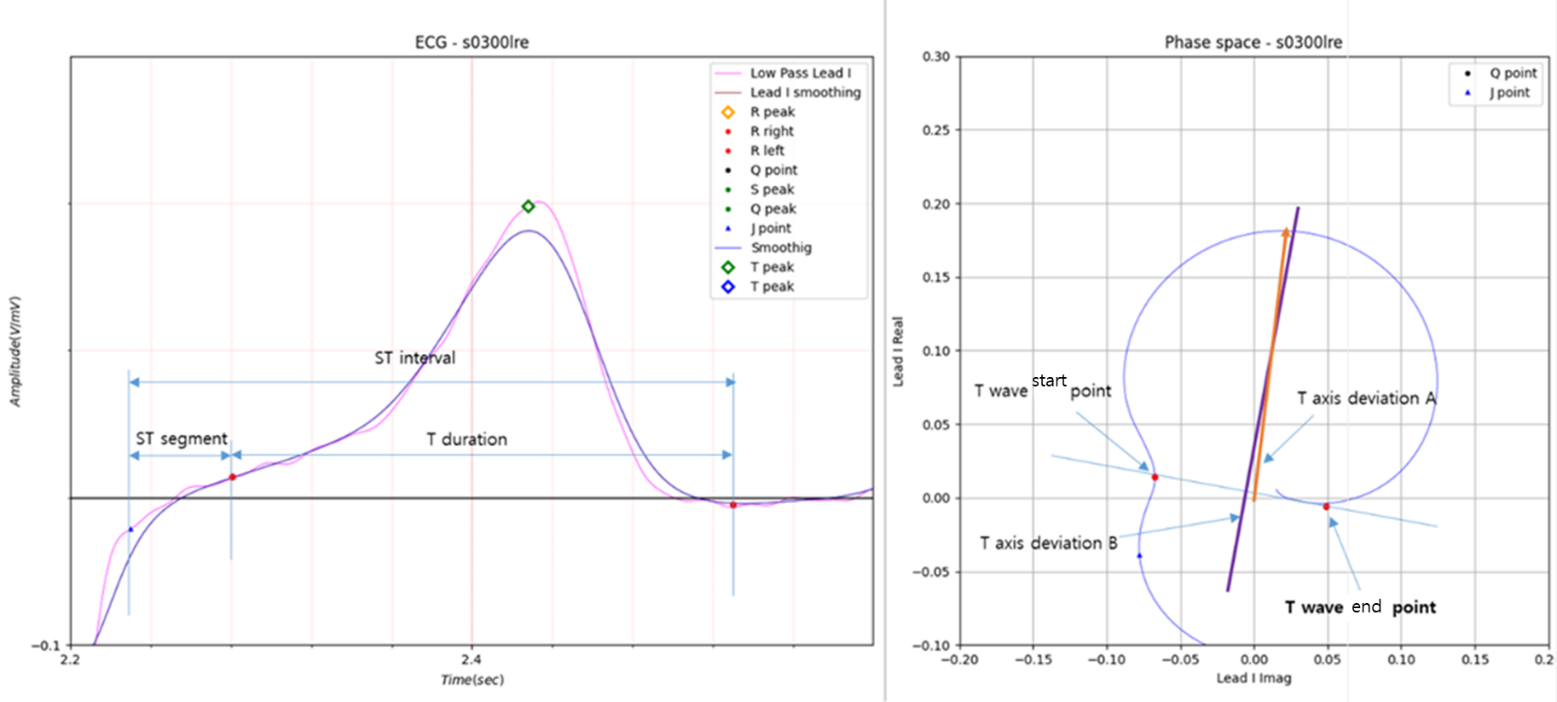
Fig.5 Normal T wave
R wave duration and P wave duration are commonly used, but T wave duration does not seem to be used often. As for the
reason, I can only guess that it is because it is not easy to determine the T wave duration start point.
Using phase space as shown in Fig.5, the T wave start point and T wave end point are very intuitive, and the T wave
duration is easily obtained.
Fig.5 shows two methods for calculating the axis deviation of the T wave.
T axis deviation A is a vector from the origin in phase space to T peak. T axis deviation B is a vector perpendicular to
the straight line formed by the T wave start point and T wave end point in a clockwise direction.
There is not much difference between the two methods in terms of the angle of the two vectors.
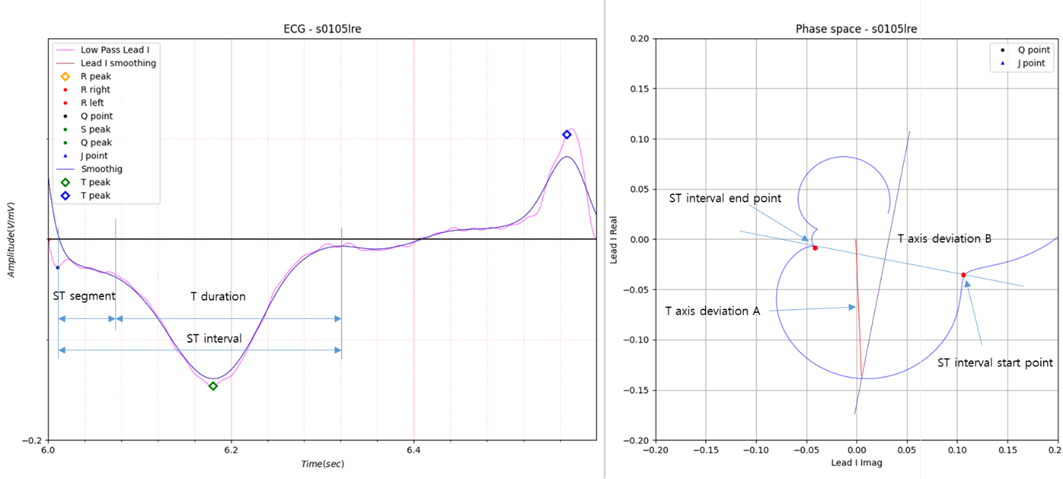
Fig.6 Inverted T wave
Fig.6 is a case of a inverted T wave. There seems to be a slight difference between T axis deviation A and T axis deviation B, but the slope of T axis deviation B looks a little more natural.
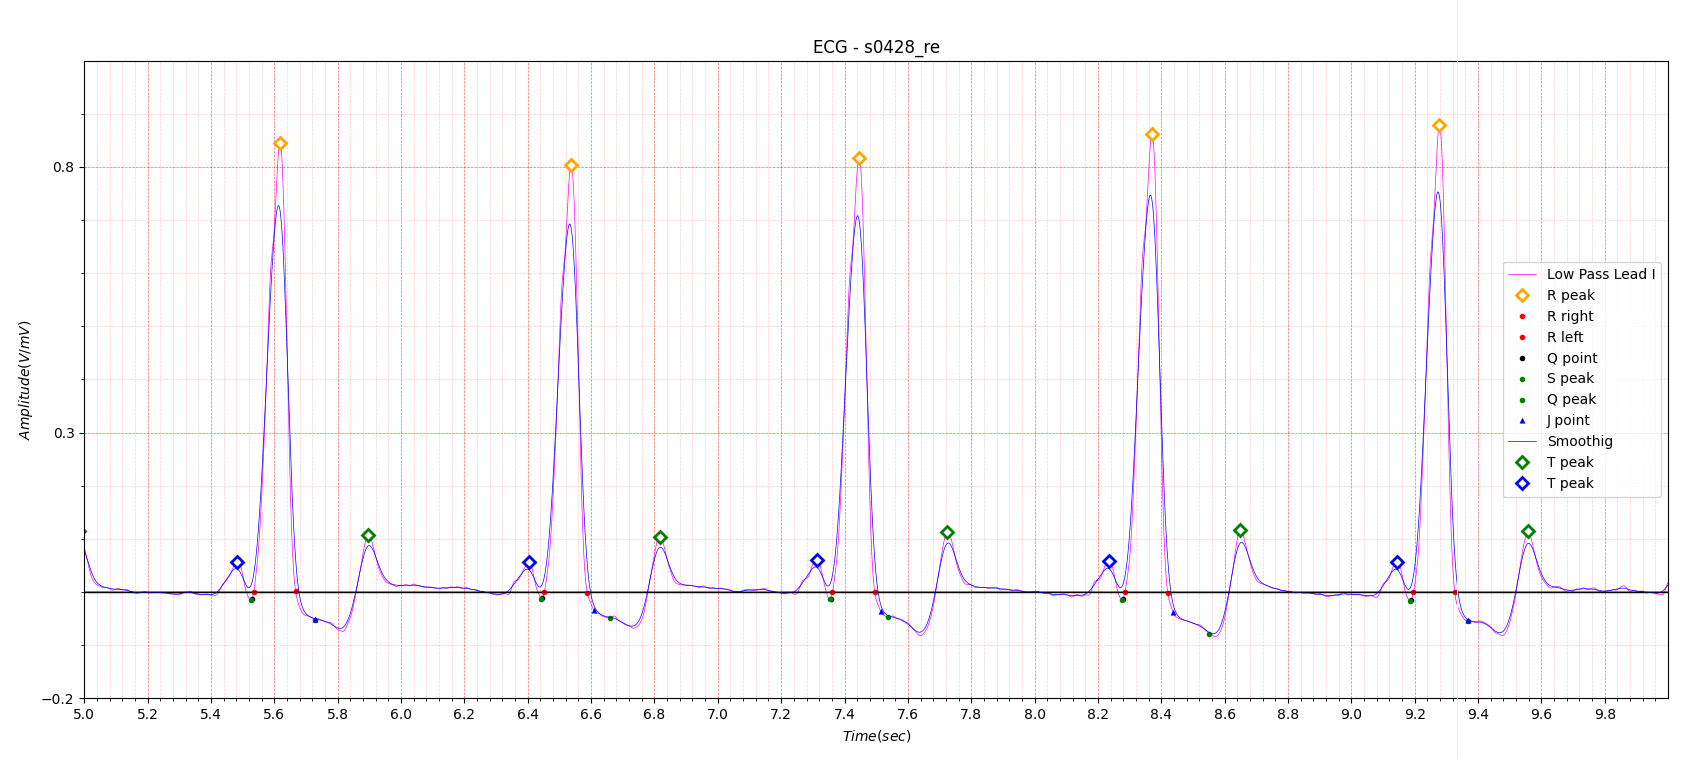
Fig.7 Biphasic T wave
- Reason for admission: Myocardial infarction
- Acute infarction (localization): no
- Former infarction (localization): anterior
- Additional diagnoses: Bundle branch block, Coxarthrosis
Fig.7 is a case of myocardial infarction accompanied by a bundle branch block.
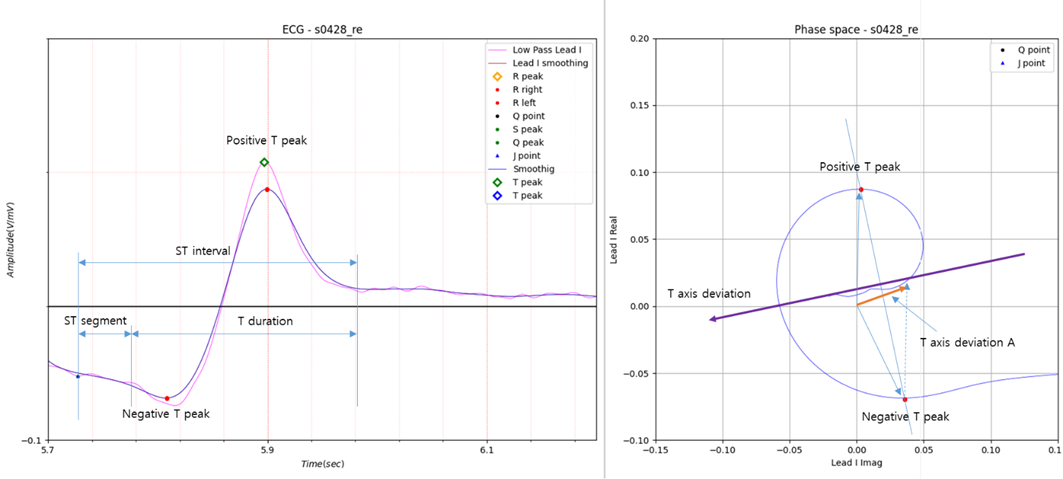
Fig.8 Biphasic T wave axis deviation A
Looking at Fig.8, the direction indicated by T axis deviation A is to the right. However, the right direction is not towards the peak. Let's take a look at T axis deviation B.
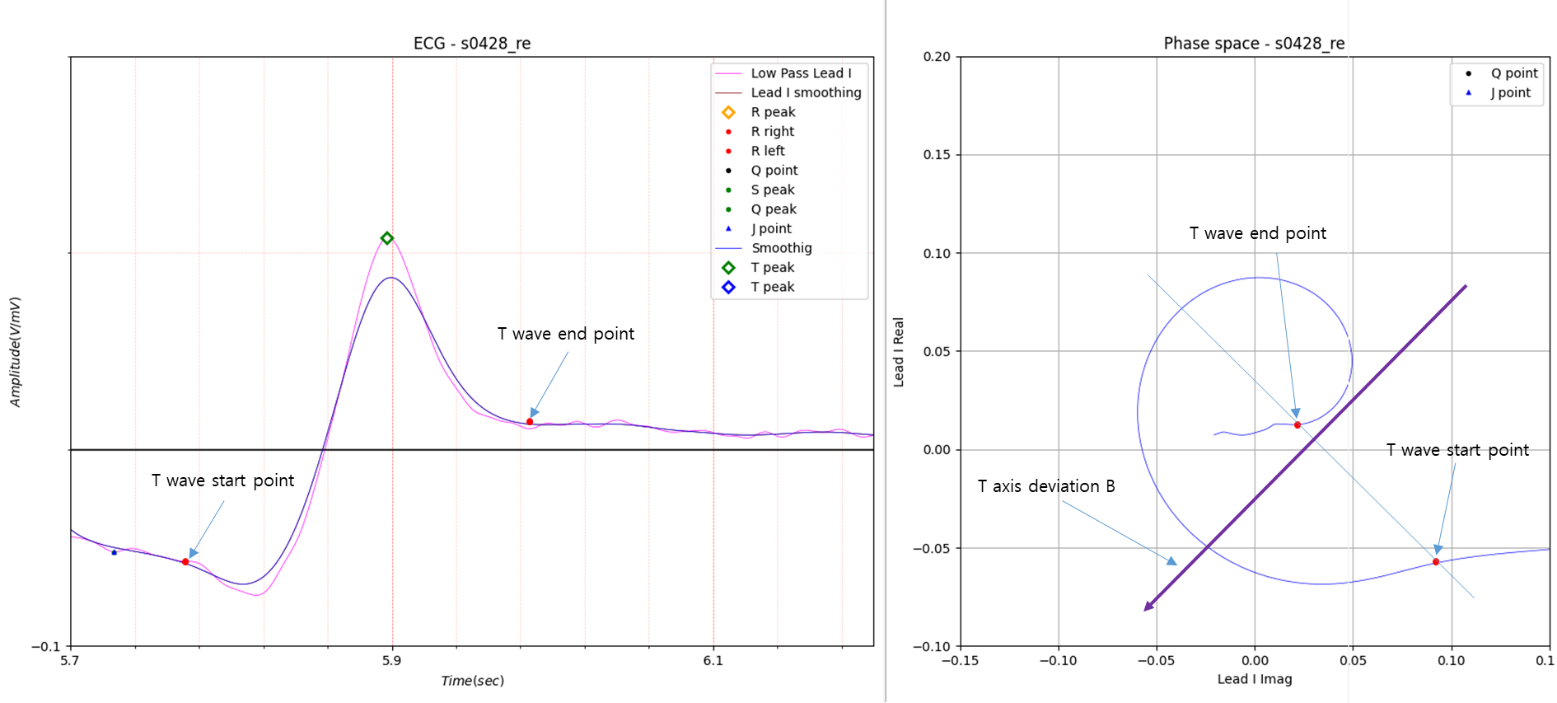
Fig.9 Biphasic T wave axis deviation B
Fig.9 shows T wave axis deviation B.
If the positive and negative peaks of the T wave are the same, the direction of the vector will be close to -90 degrees.
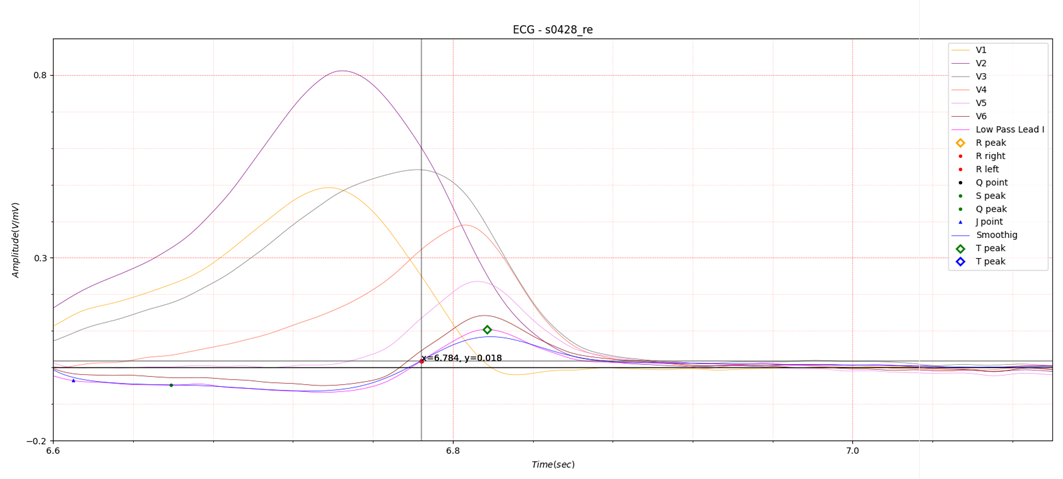
Fig.10 Biphasic T wave and V1~6
Looking at Fig.2, V1 and V6 have a phase difference of approximately 120 degrees, and V3 has a phase halfway between
V1 and V6. V6 has almost the same phase as Lead I.
Fig.10 shows the phase relationship very well. The V3 T wave peak is located at the midpoint between the positive and
negative T wave peaks of Lead I, which has a biphasic T wave.
The T wave end point is the same as the end point of the QT interval. I would like to introduce this in detail in the
next post.