Projects ECG (Electrocardiogram) Monitoring
Development technology
2. How to get ECG Axis
Deviation using Hilbert Transform
3. ECG analysis using Hilbert transform - R peak detect
4. ECG QRS complex using Hilbert transform
ECG QRS complex using Hilbert transform
There are quite a few papers and patents on QRS complex detection.The fact that there are many papers and patents about it shows that it is difficult to perfectly detect the QRS complex.
Here we introduce a method to detect QRS complex using Hilbert transform.
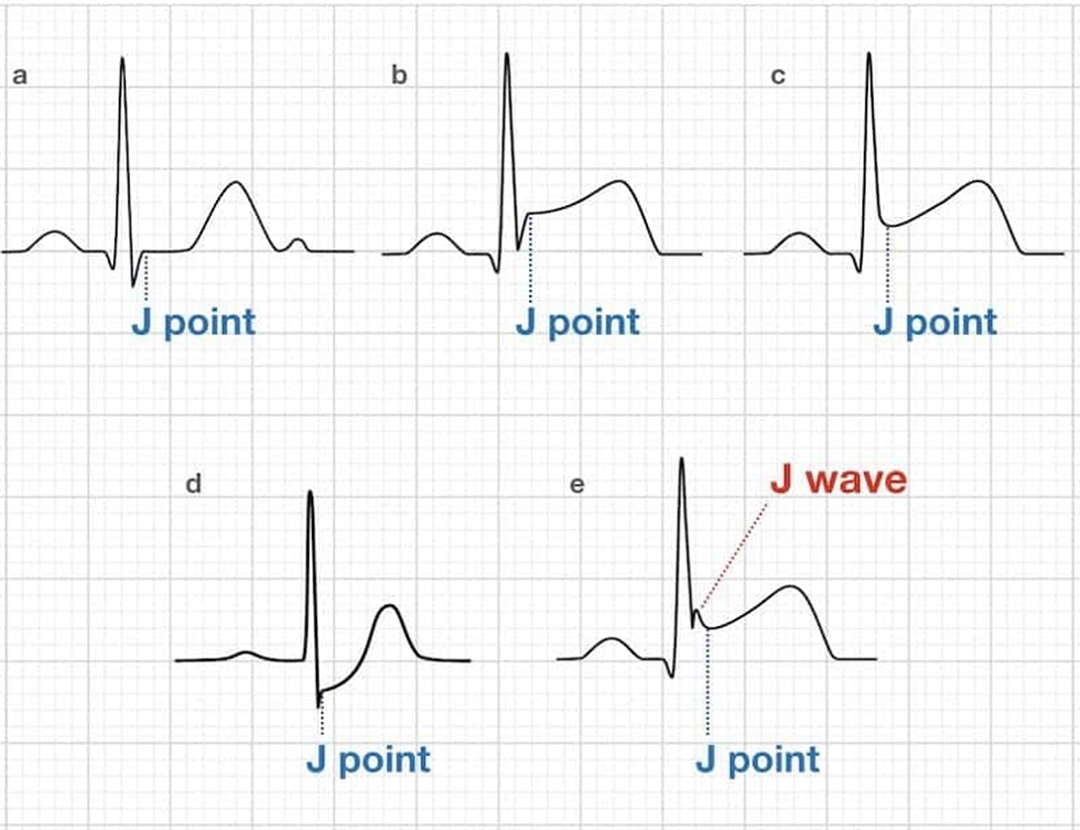
Figure 1
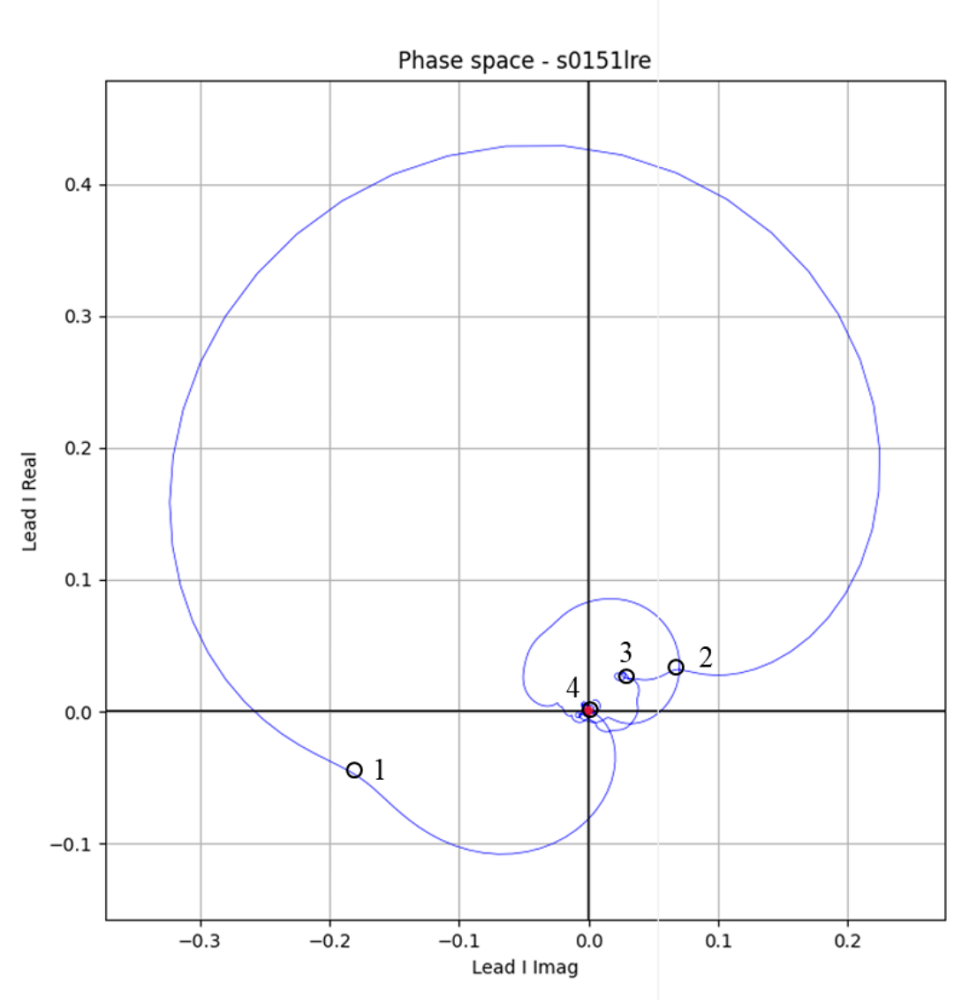
Figure 2. point1: Q point / point2: J point
Fig. 1 shows various forms of the J point, which is an element of the QRS complex.
Let's access the factors that make up the QRS complex using the Hilbert transform as shown in Figure2 and
prove the Q point and J point shown in Figure 2 in detail through various examples.
In several algorithms for QRS complex detection, I found something uncertain and ambiguous and tried to solve it. The
method introduced below is probably already patented. It is very difficult for a non-expert to research whether the
method I use is already patented.
The reason I want to introduce this method is to check the uncertainty of the Q point and J point that make up the QRS
complex.
Let's look at the following figures.
1. Find Q point
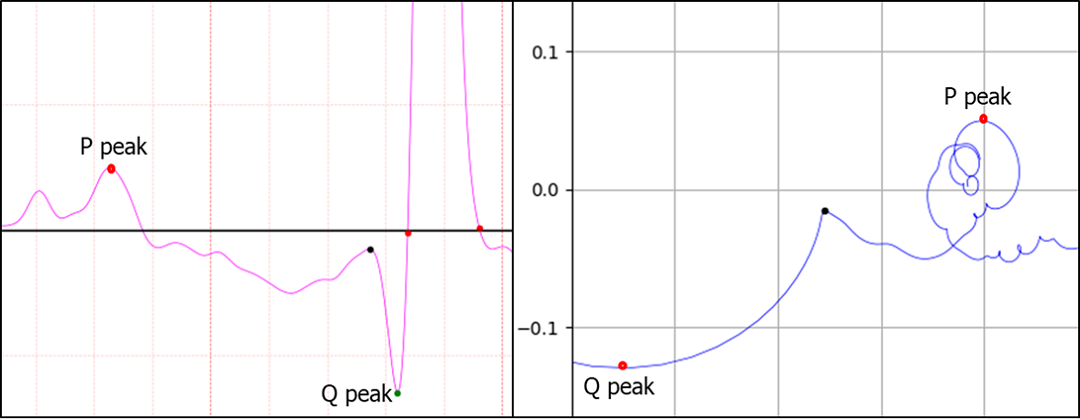
Figure 3. Q point is peak
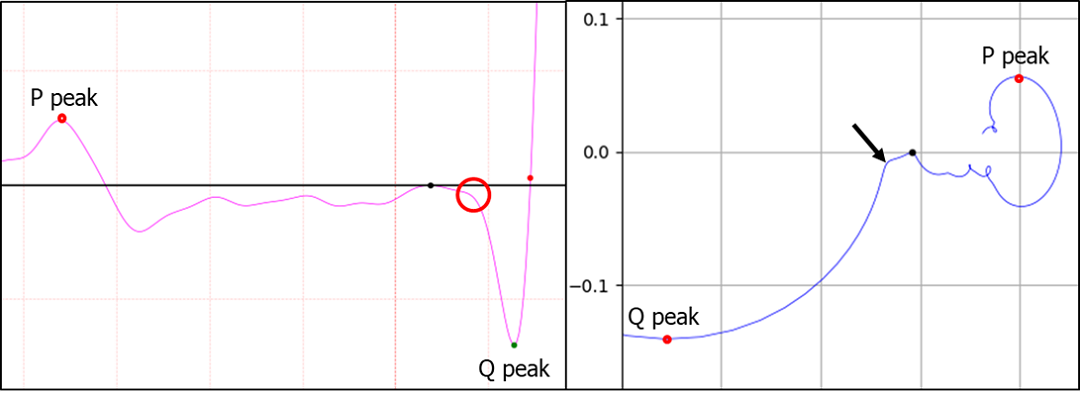
Figure 4. Q point is not peak
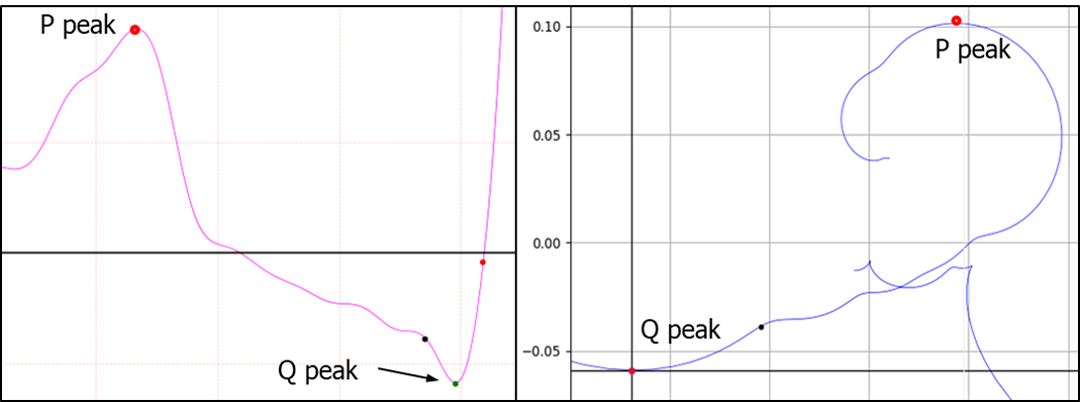
Figure 5. Q point is not peak, peak is far away
One way to find the Q point is to look for the first peak in the direction from the Q peak to the P peak. Draw a straight line between Q peaks and find the point furthest from the straight line. If the point is above a certain value, it is accepted as a case like Figure 4. How vague is this? The inflection points of the curve leading to the Q peak are 1 in Figure 3, 3 in Figure 4, and 5 in Figure 5. In the case of Figure 3, the Q peak and peak have third derivatives. Therefore, there is only one inflection point. Now let's look at Fig. 4. Which point in the red circle in Fig. 4 is the Q point? Can you determine which point in the red circle is a definite Q point? I think this uncertainty is the reason why so many papers and patents exist. That uncertainty is also the cause of errors.
The arrow in the right phase space of Figure 4 indicates exactly one point. If this point is Q point, the ambiguity of Q point disappears for an instant. This also applies to J point.
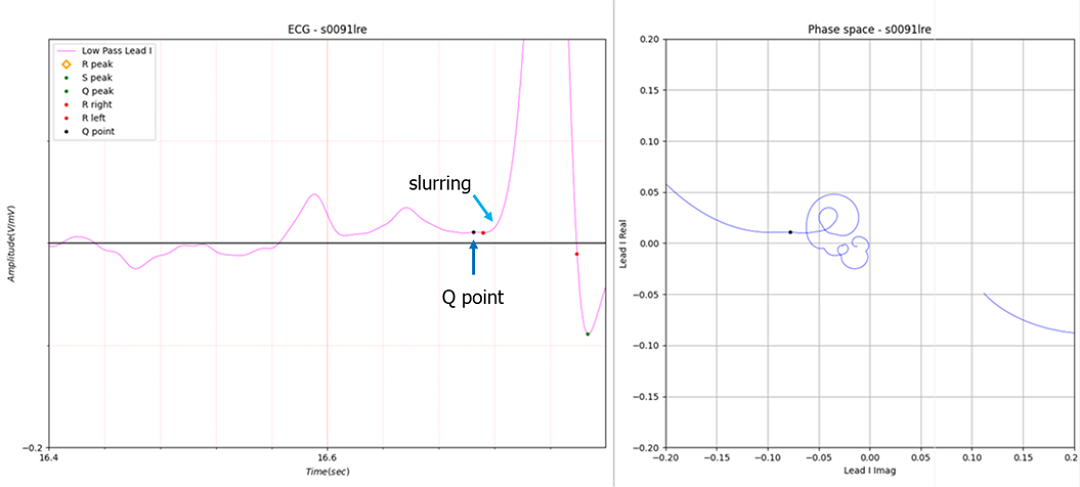
Figure 6. slurring (no peak)
The Q peak is uncertain and the peak does not exist. If you look closely at the Q point of the right phase space, the curve is slightly dented.
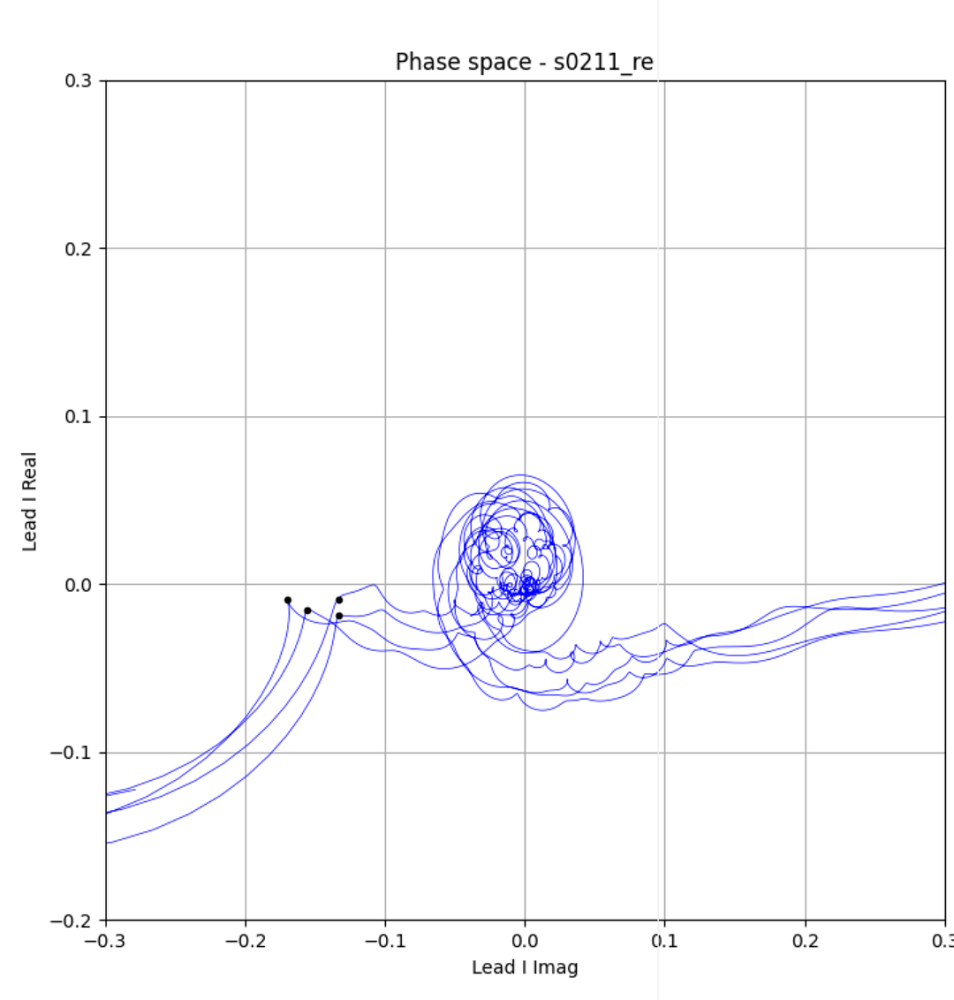
Figure 7. peak exist
Among the four points in Fig. 7, the part with the arrow is in the case of Fig. 4, and the remaining three points are in the case of Fig. 3. Finding the point where the Q wave is slightly distorted requires quite specialized numerical analysis techniques.
In the case of Fig. 5, the distorted point closest to the Q peak in phase space is the Q point. In the phase space of Fig. 5, the dots do not represent the distorted position of the Q wave. This is simply a result of capturing the distorted position of the Q wave in phase space before accurately calculating it.
2. Find J point
The process of finding the J point is basically the same as the process of finding the Q point.
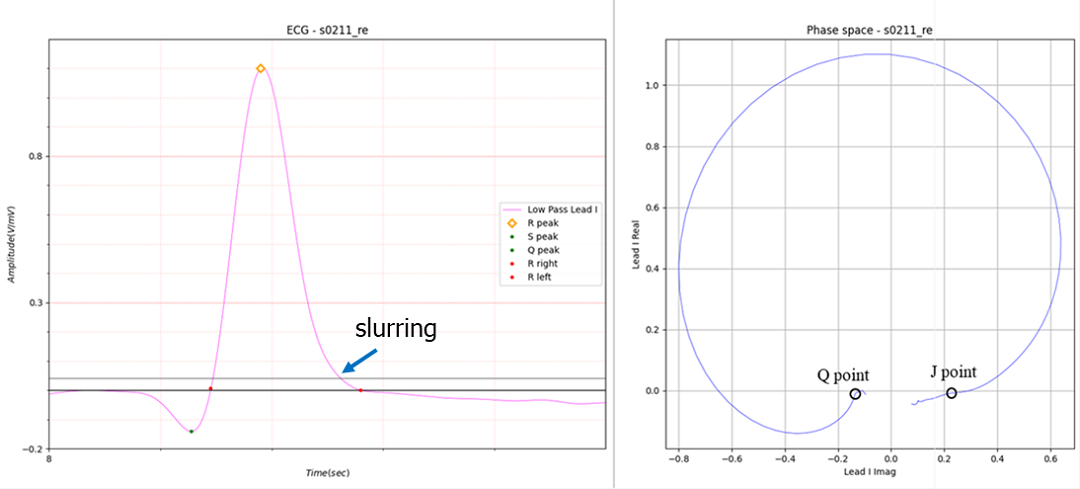
Figure 8. J point is slurring
As shown in Figure 8, if there is no S peak and no peaks around the S peak, slurring is said to occur. In this case as well, there is no absolute standard as to which point is the J point.
However, as seen in the Q point, it clearly represents one point in phase space.
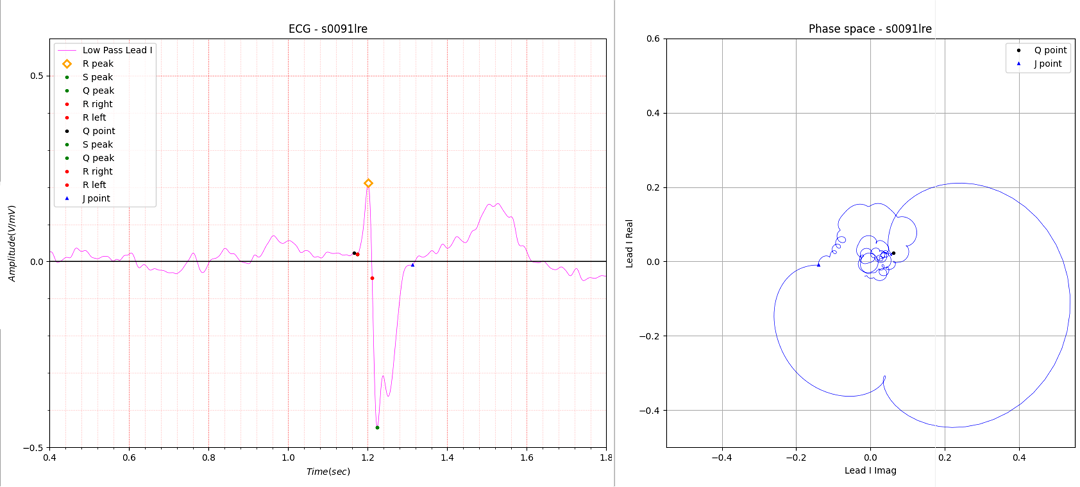
Figure 9. peak is unclear
In the case of Fig. 9, there appears to be a peak. If a peak exists, the peak must be corrected to the J point. Now, I am using an algorithm to find the distorted part of the circle, so the error occurs because the peak does not correspond to the distorted part. While searching for the distorted part in complex coordinates (phase space) up to the first peak after the S peak, an interfering peak appeared. These interfering peak should be excluded.
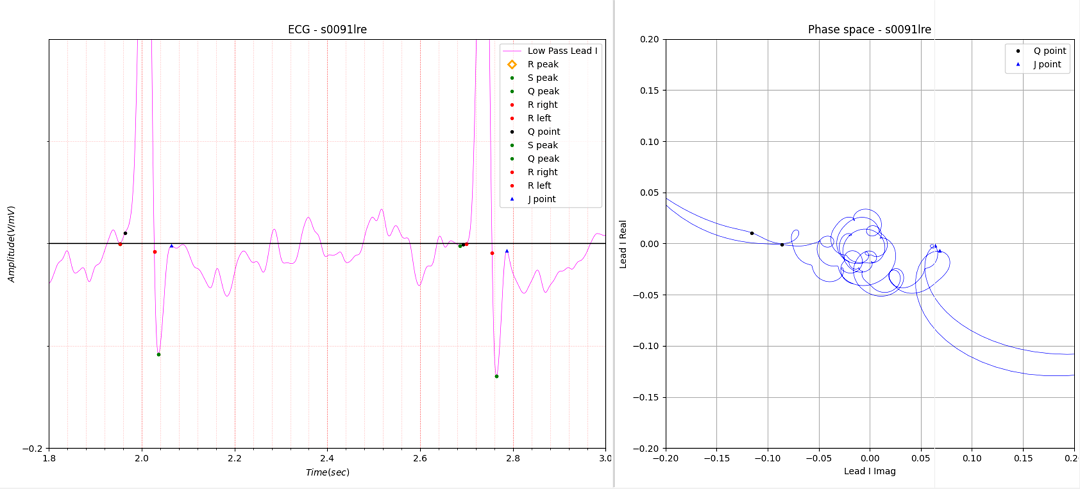
Figure 10. The sharp peak have a small loop
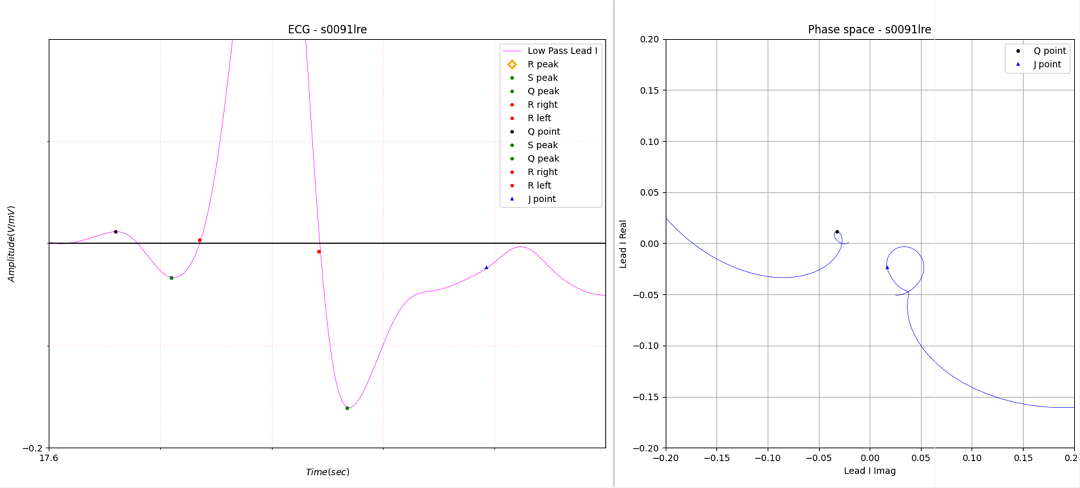
Figure 11. wrong J point
Figure 11 shows an example of an incorrect J point. An error occurred when a peak did not exist within a specific section.
It can be modified very simply. The first distorted point after S peak is J point.
3. Conclusion
I have asserted the superiority of the Hilbert transform in electrocardiogram analysis through several articles on LinkedIn and also emphasized finding each element of the ECG accurately from a single lead, but I think that if accurate results are obtained from a single lead, more accurate results can be obtained when using multiple leads.
If it can overcome many patent barriers regarding the method of finding QRS complex elements, and if the method using the Hilbert transform is more accurate than any other method so far, I think there is no choice but to use that method.