Projects ECG (Electrocardiogram) Monitoring
Development technology
2. How to get ECG Axis
Deviation using Hilbert Transform
3. ECG analysis using Hilbert transform - R peak detect
4. ECG QRS complex using Hilbert transform
How to get ECG Axis Deviation using Hilbert Transform
*** The data used here utilized the ECG database of
'Physikalisch-Technische Bundesanstalt(PTB), the National Metrology Institute of Germany'.
When a certain real signal is x(t) and the Hilbert-transformed signal is xˆ(t),
the signal xp(t) = x(t) + jxˆ(t) can be considered by extending it to the complex
number.

The signum function of f is defined as follows:

The Fourier transform of the Hilbert transform of x(t) is defined as follows
F{(xˆ)}=−j sgn f⋅F{x(t)}
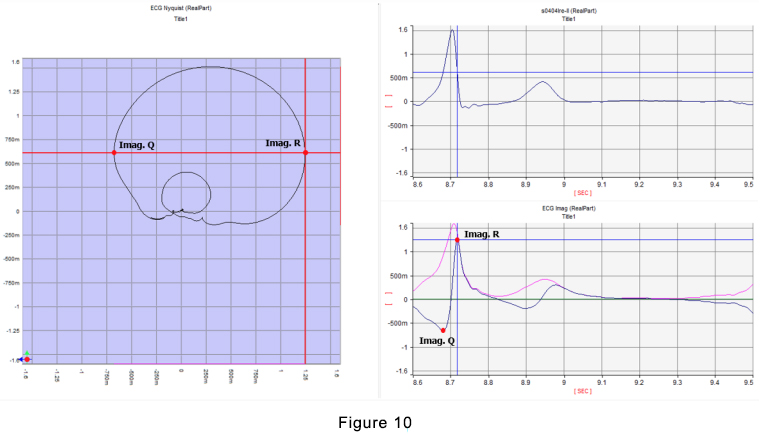
Now, it is possible to have Nyquist plot if the real part of xp(t) is the y-axis and the
imaginary part of xp(t) is the x-axis.
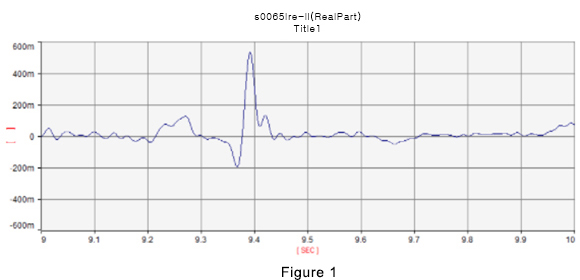
Typical ECG Signal is shown above.
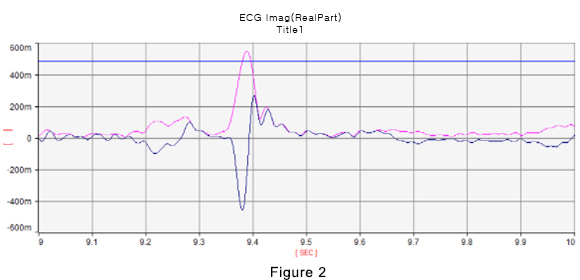
The blue line was obtained using Hilbert Transform. Let's do this as an Imagine part.
The pink line is drawn by obtaining the envelope using (Figure 1) Real part and (Figure 2)
Imaginary part.
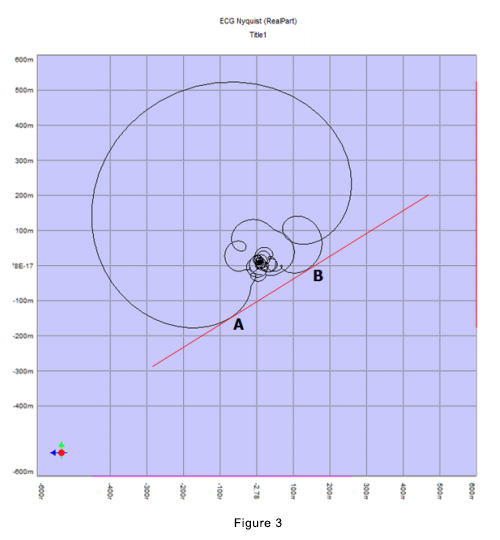
Figure 3. is a graph drawn to help you understand. This is often referred to as the Nyquist
Plot, with ECG Signal's Real
part on the Y-axis and Imaginary part on the X-axis.
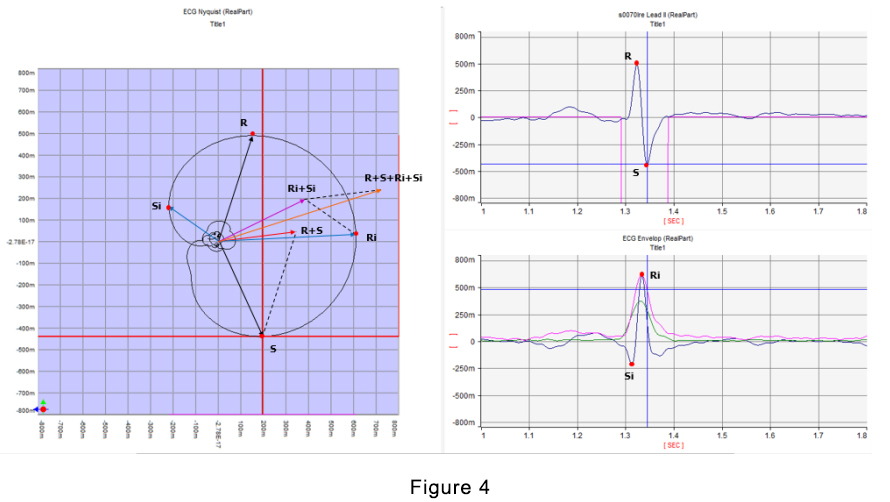
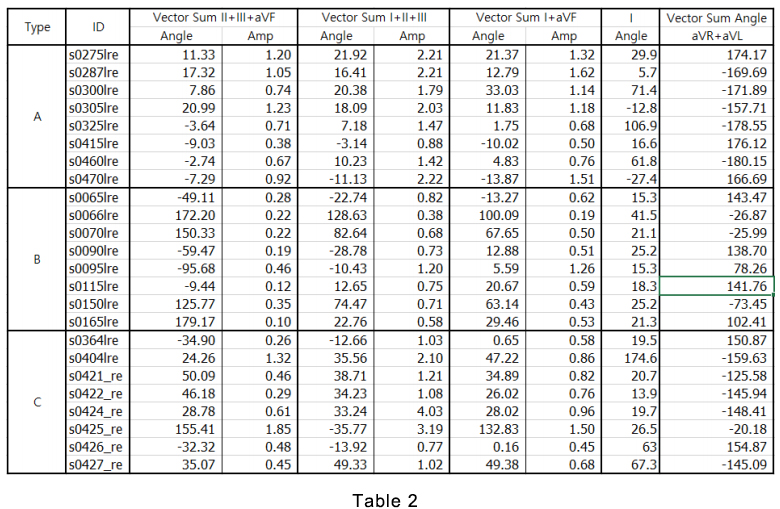
There are several methods to obtain the axis deviation, but here, as in the figure above,
the sum of vectors is obtained
and expressed as the slope of the vector sum. The angle took the positive direction of the
Y-axis to 0 degrees.
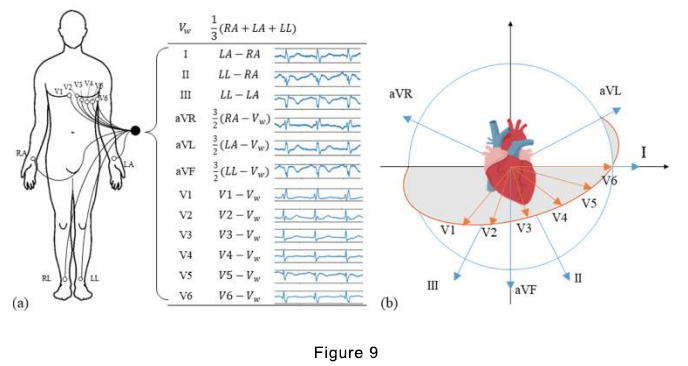
First, the Nyquist diagram for the 12 lead ECG is as follows.
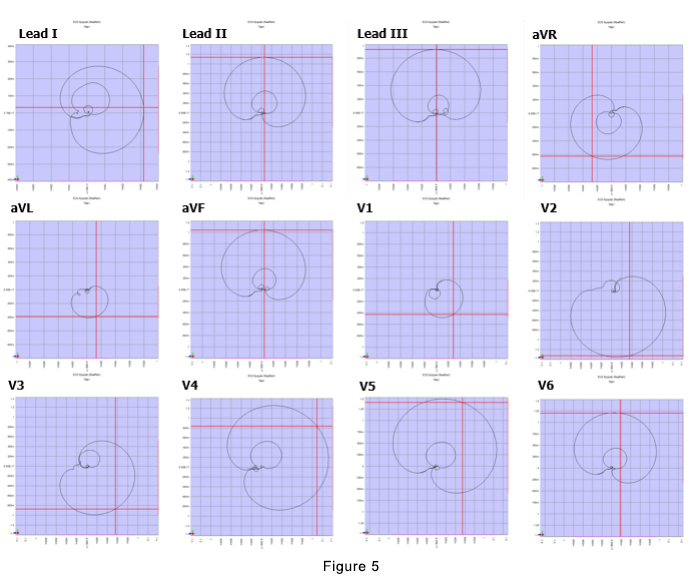
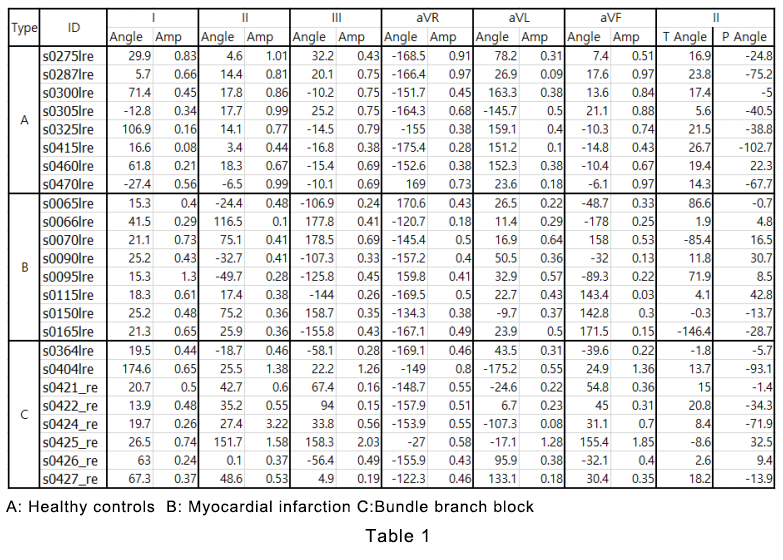
By the method of Figure 4,5, eight data of healthy controls, myocardial infarction, and
bundle branch block, respectively,
are shown in Figures 6, 7, and 8 as follows.
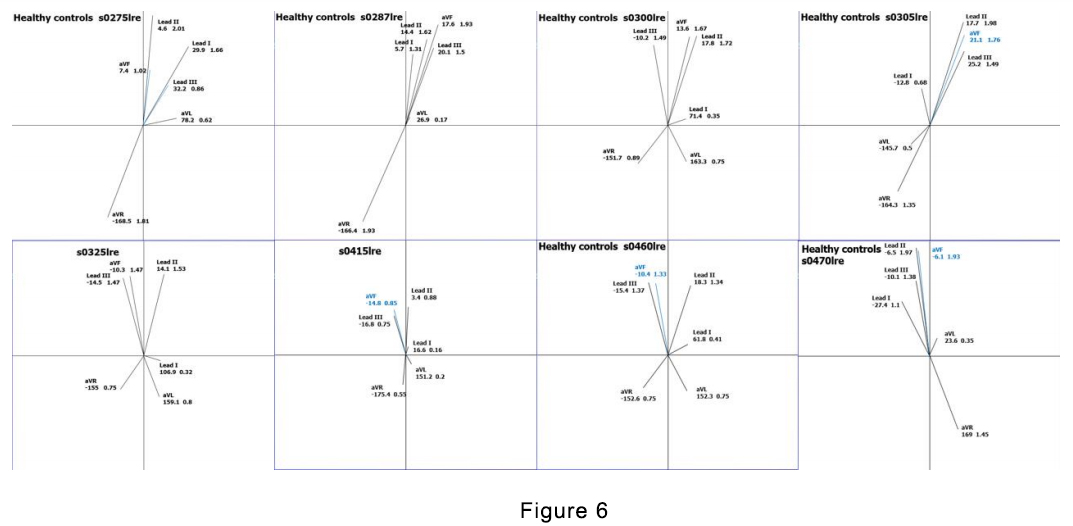
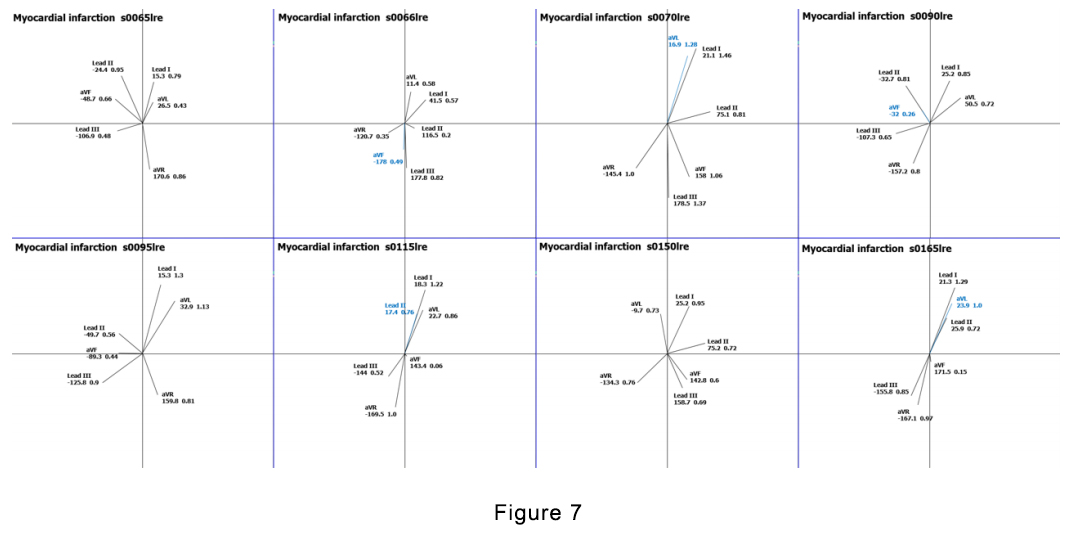
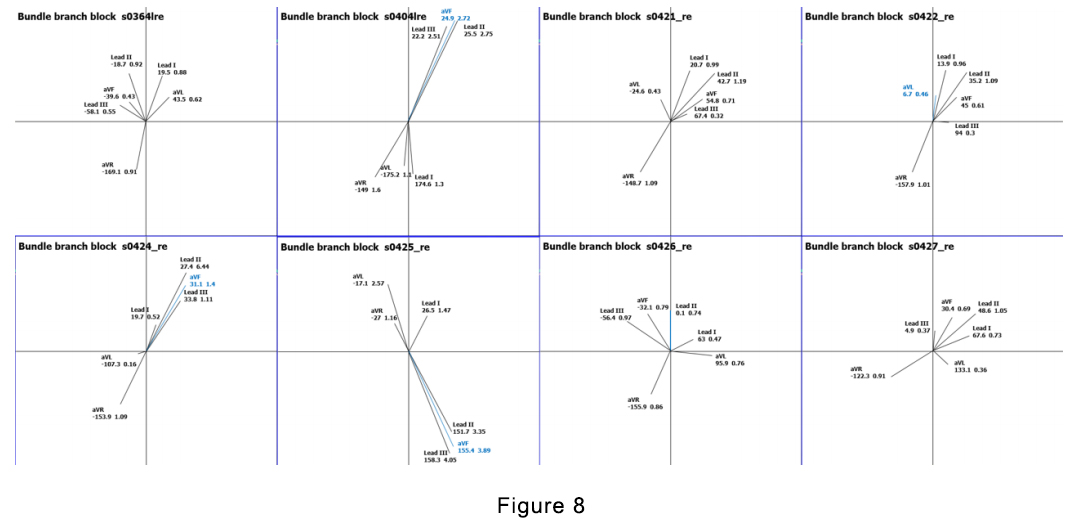
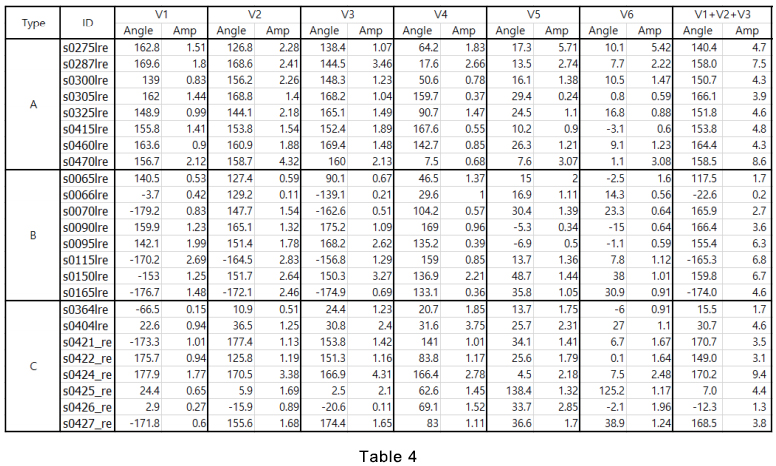
-> Table 1 and 2 show the summary of above three cases.
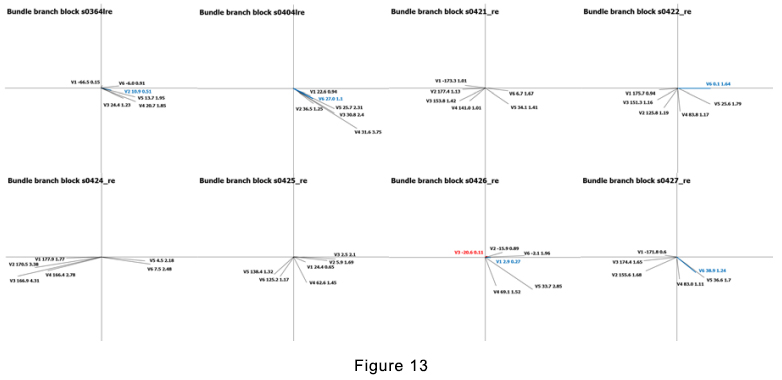
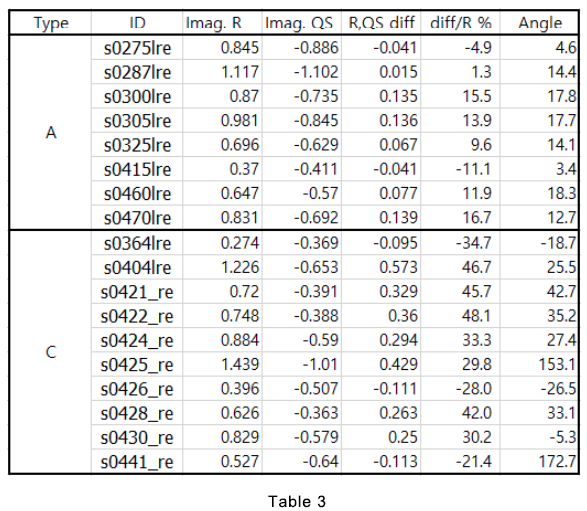
In the case of Bundle branch blocks, left and right asymmetries occur frequently.
This is shown in Table 3 compared to Healthy controls.
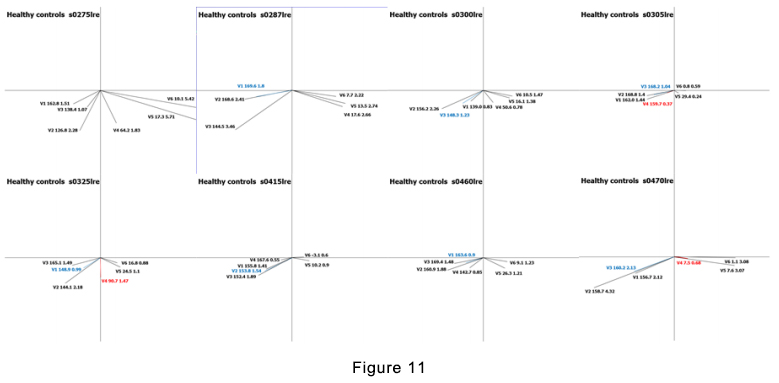
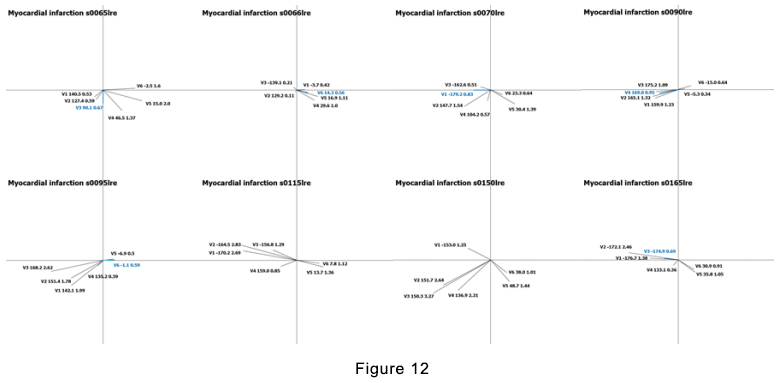
-> Figures 11 to 13 show V1 to V6 in a summary.
