Projects ECG (Electrocardiogram) Monitoring
Development technology
2. How to get ECG Axis
Deviation using Hilbert Transform
3. ECG analysis using Hilbert transform - R peak detect
4. ECG QRS complex using Hilbert transform
ECG analysis using Hilbert transform - R peak detect
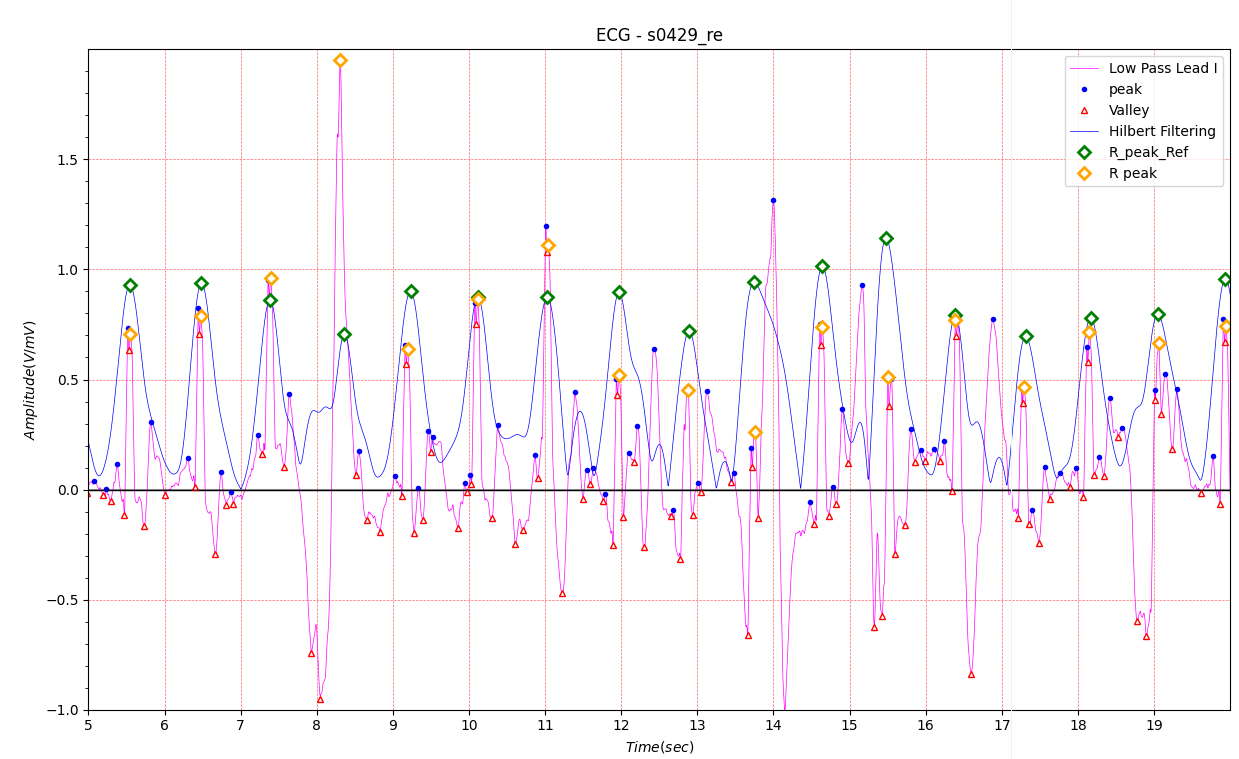
Figure1. s0429_re
# Reason for admission: Bundle branch block
# Acute infarction (localization): no
# Former infarction (localization): no
# Additional diagnoses: no
Figure1 looks complicated, so let’s split it into three graphs.
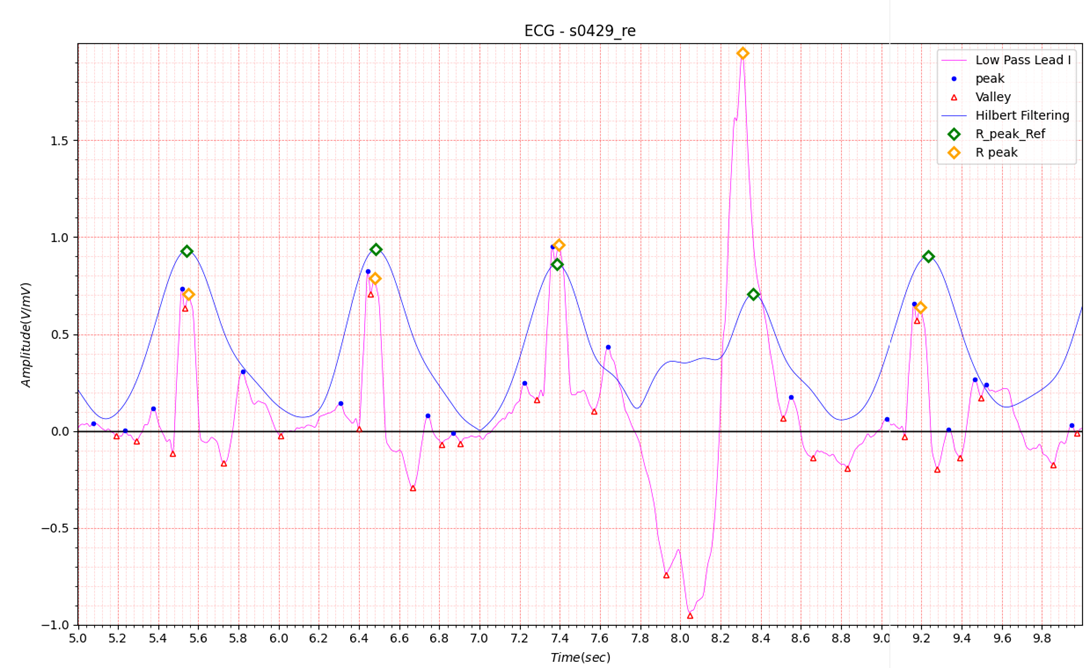
Figure2. s0429_re(5~10sec)
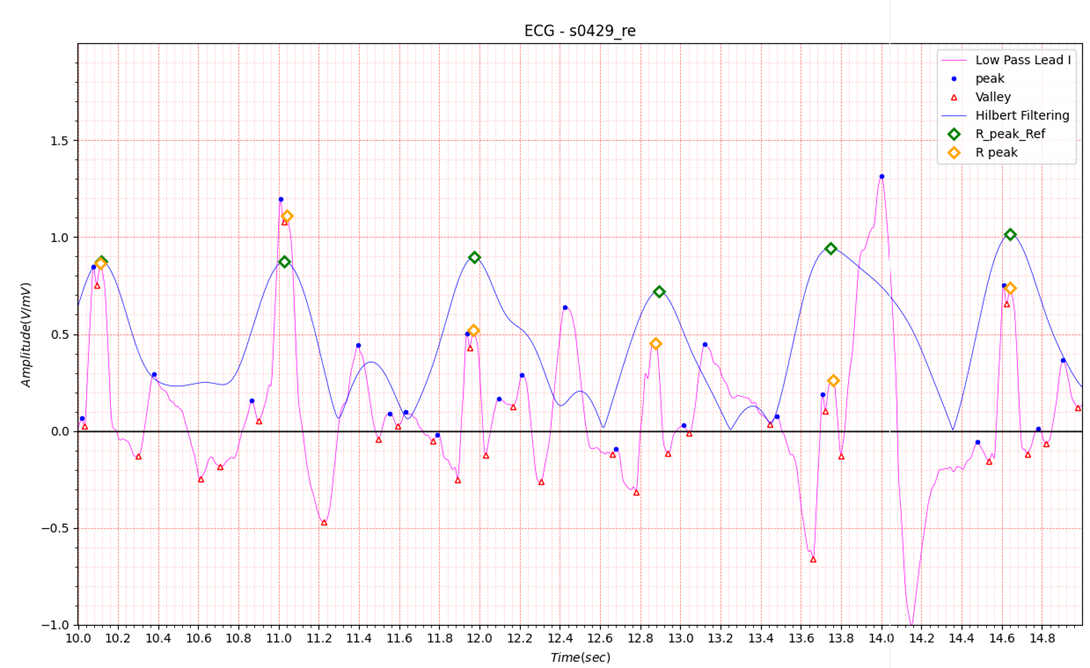
Figure3. s0429_re(10~15sec)
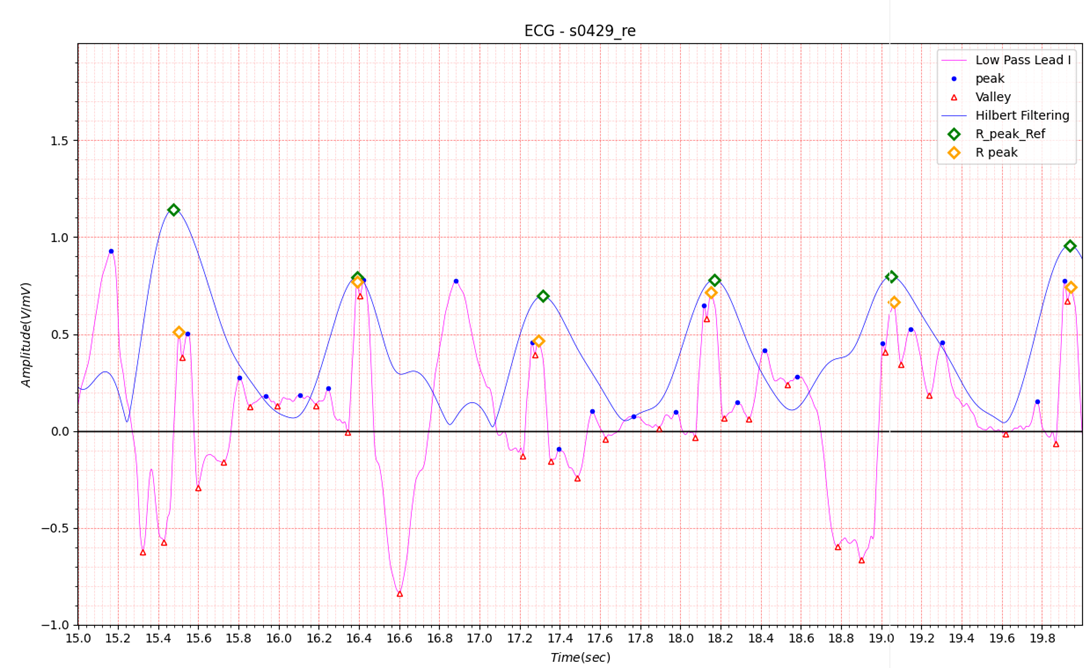
Figure4. s0429_re(15~20sec)
To confirm that the R peak shown in the three graphs above was properly detected, V3 was overlaid on the following graph. In a 12-lead system, if there is a lead that is difficult to determine, other leads can be referred to, but in a system that uses a single lead, such as a smart watch, it is difficult to accurately find the R peak.
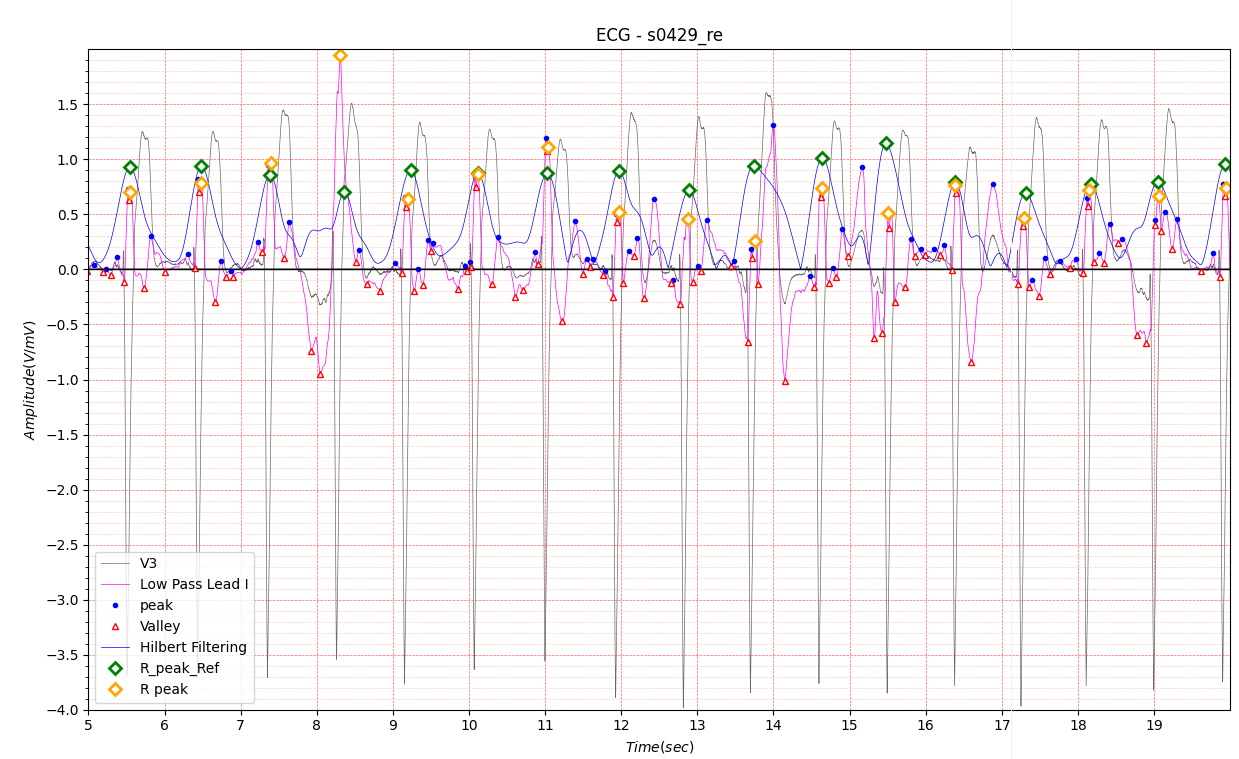
Figure5. s0429_re Lead Ⅰ&Ⅴ
Some examples are added as below.
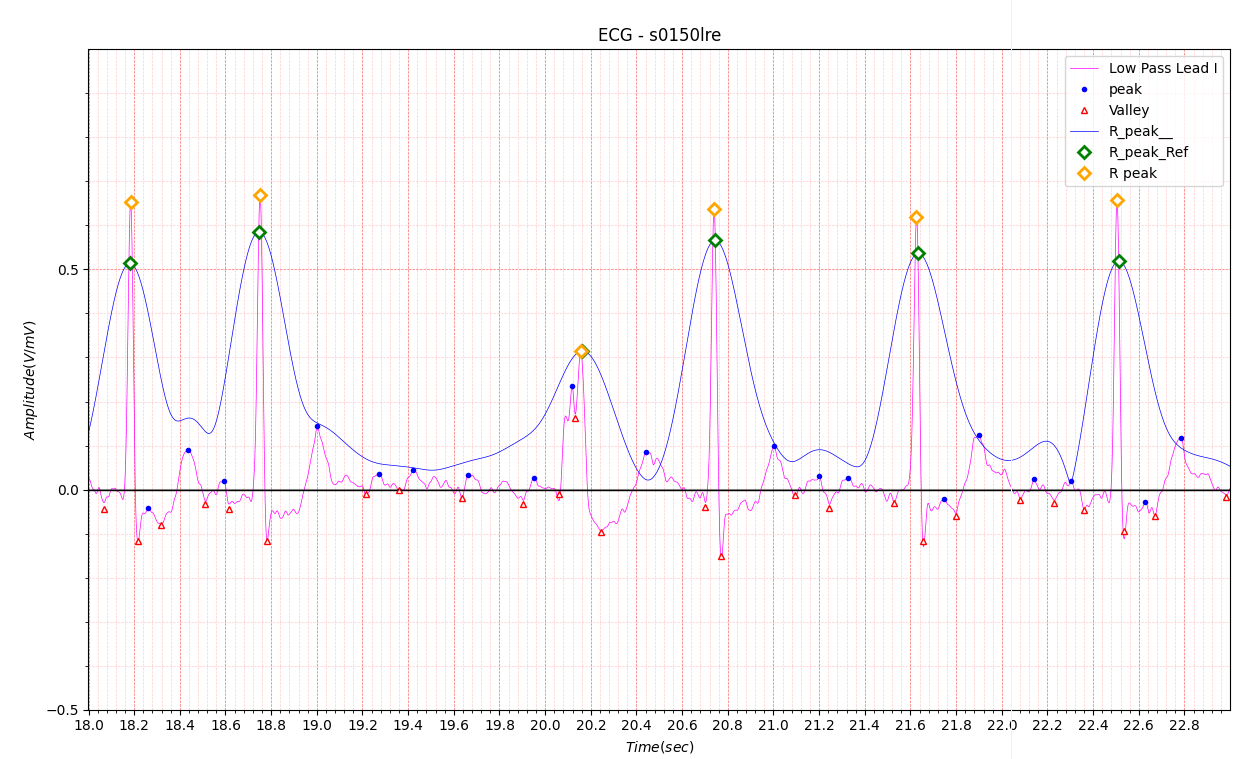
Figure6. s0150lre
# Reason for admission: Myocardial infarction
# Acute infarction (localization): antero-septal
# Former infarction (localization): no
# Additional diagnoses: Diabetes mellitus, Arterial hypertension
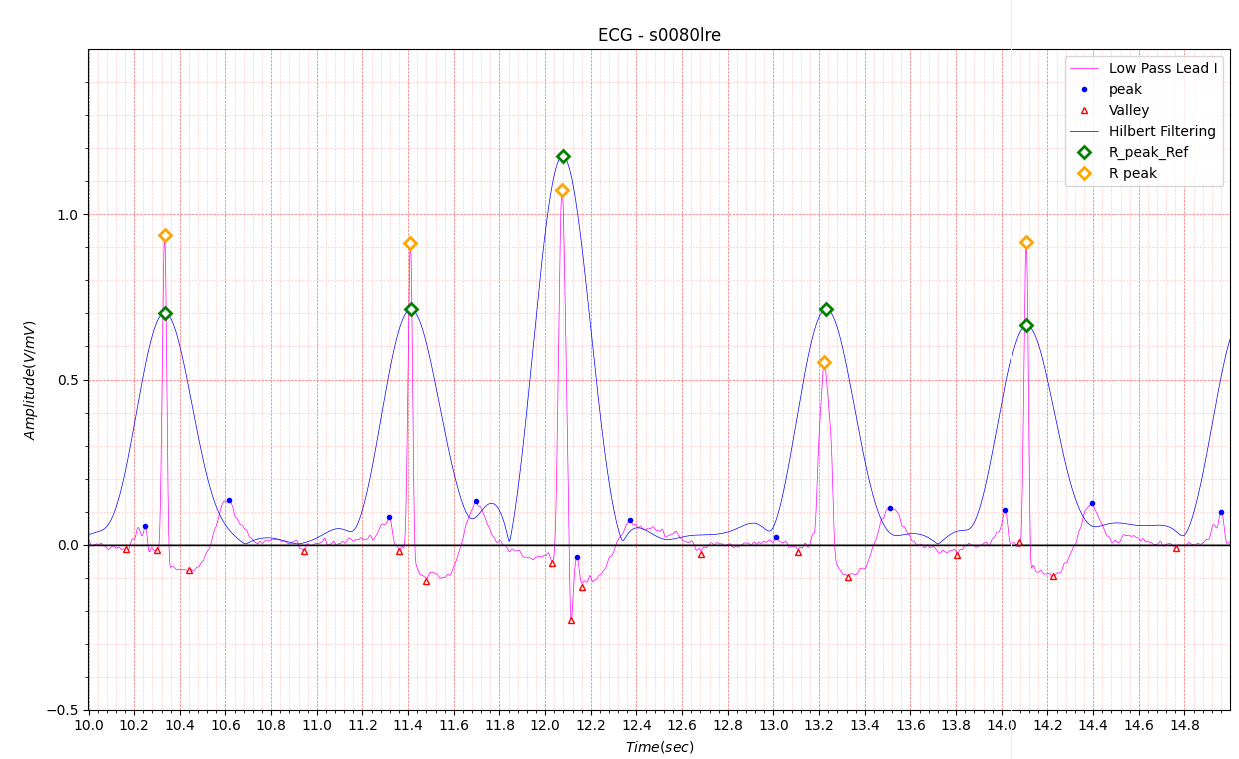
Figure7. s0080lre
# Reason for admission: Myocardial infarction
# Acute infarction (localization): inferior
# Former infarction (localization): no
# Additional diagnoses: Hypercholesterinemia, peripheral atherosclerosis
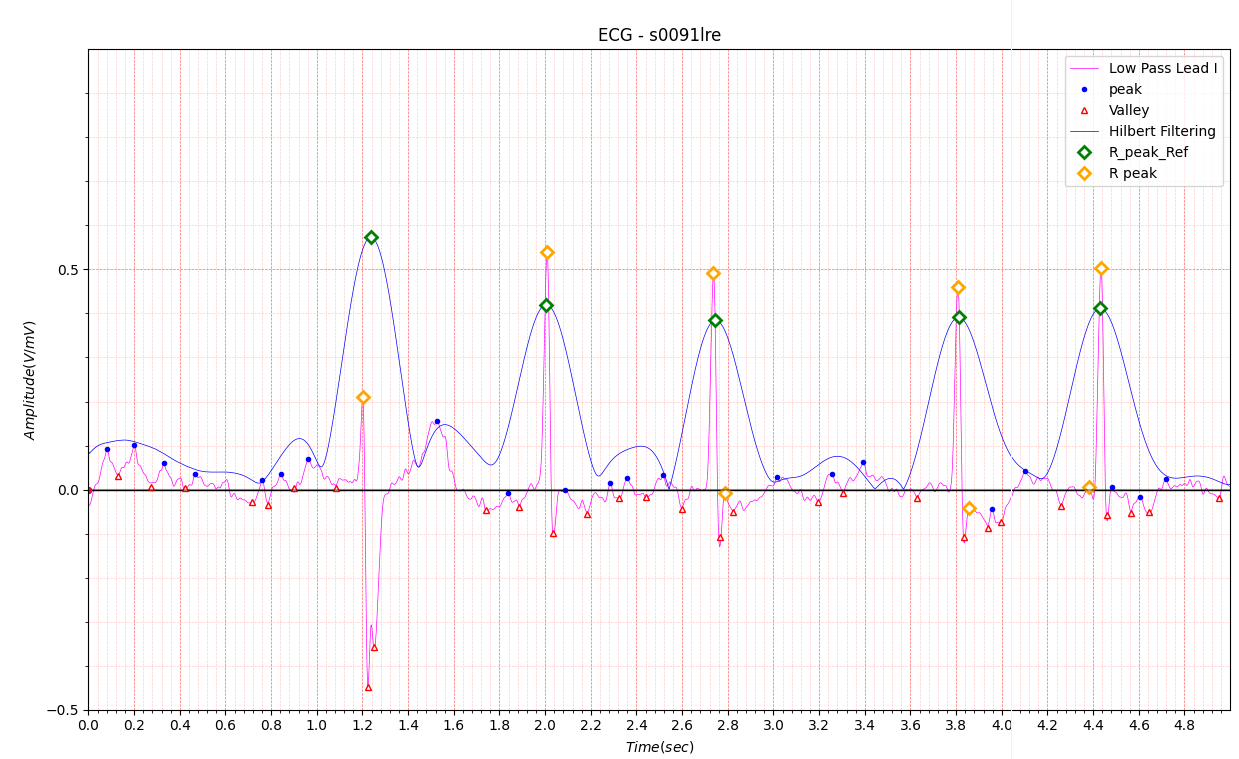
Figure8. s0091lre
# Reason for admission: Myocardial infarction
# Acute infarction (localization): antero-septal
# Former infarction (localization): no
# Additional diagnoses: Diabetes mellitus, Arterial hypertension
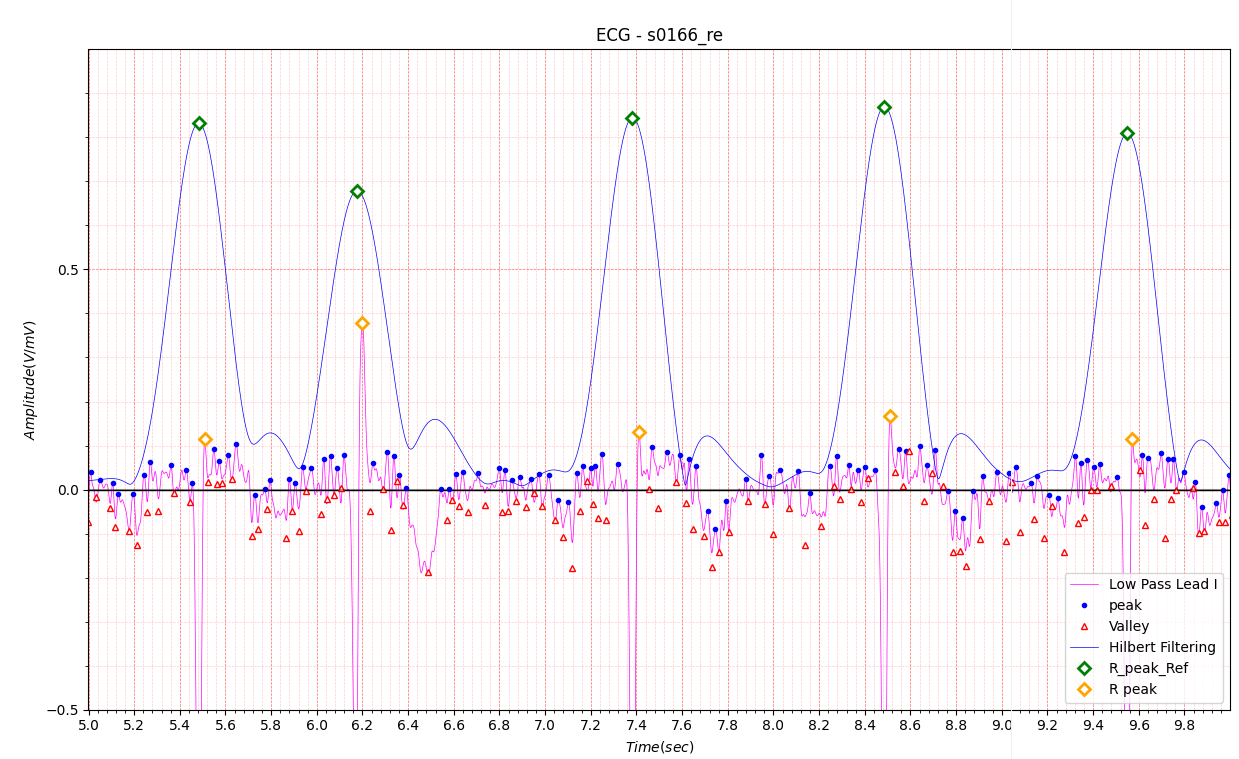
Figure9. s0166_re
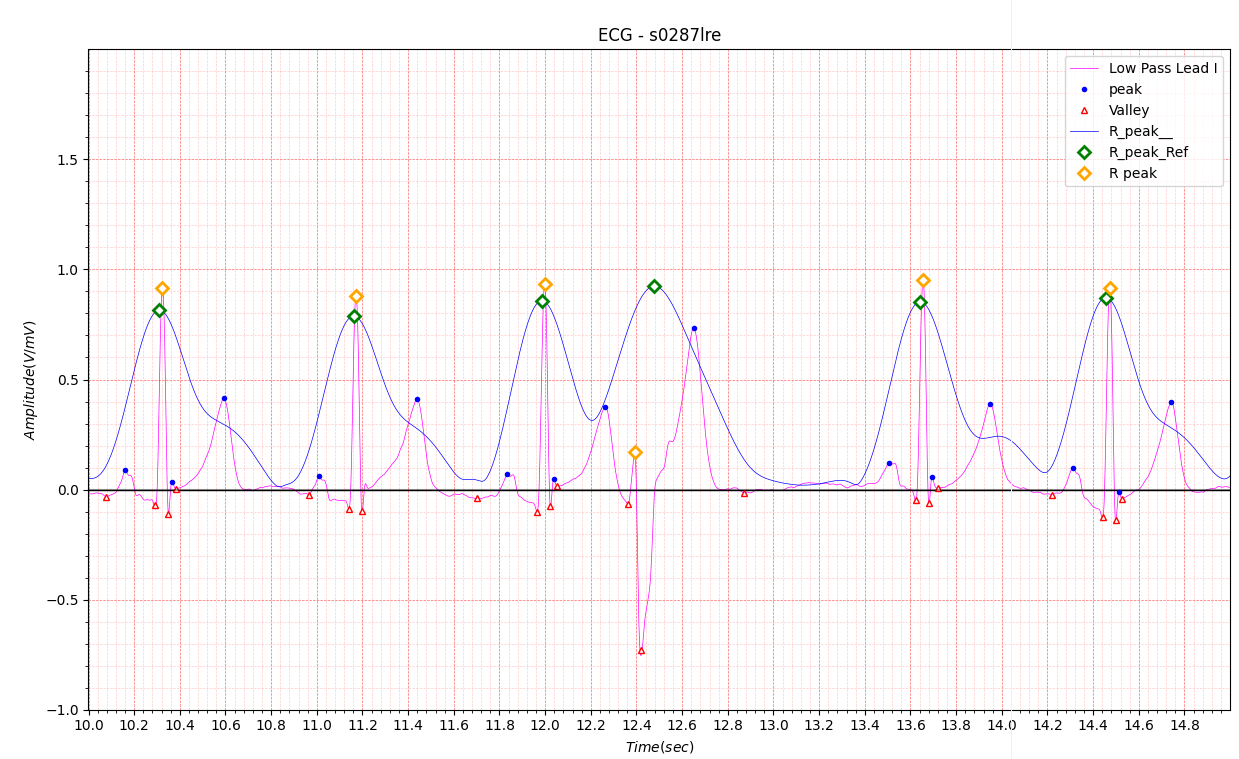
Figure10. s0287lre
Electrocardiogram database of PTB(Physikalisch-Technische Bundesanstalt:https://www.ptb.de/cms/en.html) is used for electrocardiogram analysis.
As a result of testing the following items for R peak detection, there were no R peak detection errors as a result of testing on 33 seconds of data for each item.
# Myocardial infarction 148
# Cardiomyopathy/Heart failure 18
# Bundle branch block 15
# Dysrhythmia 14